
提供最佳价差和条件
 关于平台
关于平台

AUD/USD was a strong performer at the start of the week and benefitted from the risk-off unwind that occurred on the back of positive sentiment surrounding the covid headlines that indicate the new variant is less severe.
Consequently, AUD/USD has taken on the mid-point of the 0.70 area and is now consolidating ahead of the Reserve bank of Australia risk later today. There is little chance of a continuation ahead of the event but every chance that volatility could arise around the event. The following illustrates the bullish and bearish outcomes that could arise one way or the other from a technical perspective.
From a long term analysis, the M-formation, which is a bullish reversion pattern, has been illustrated as follows:
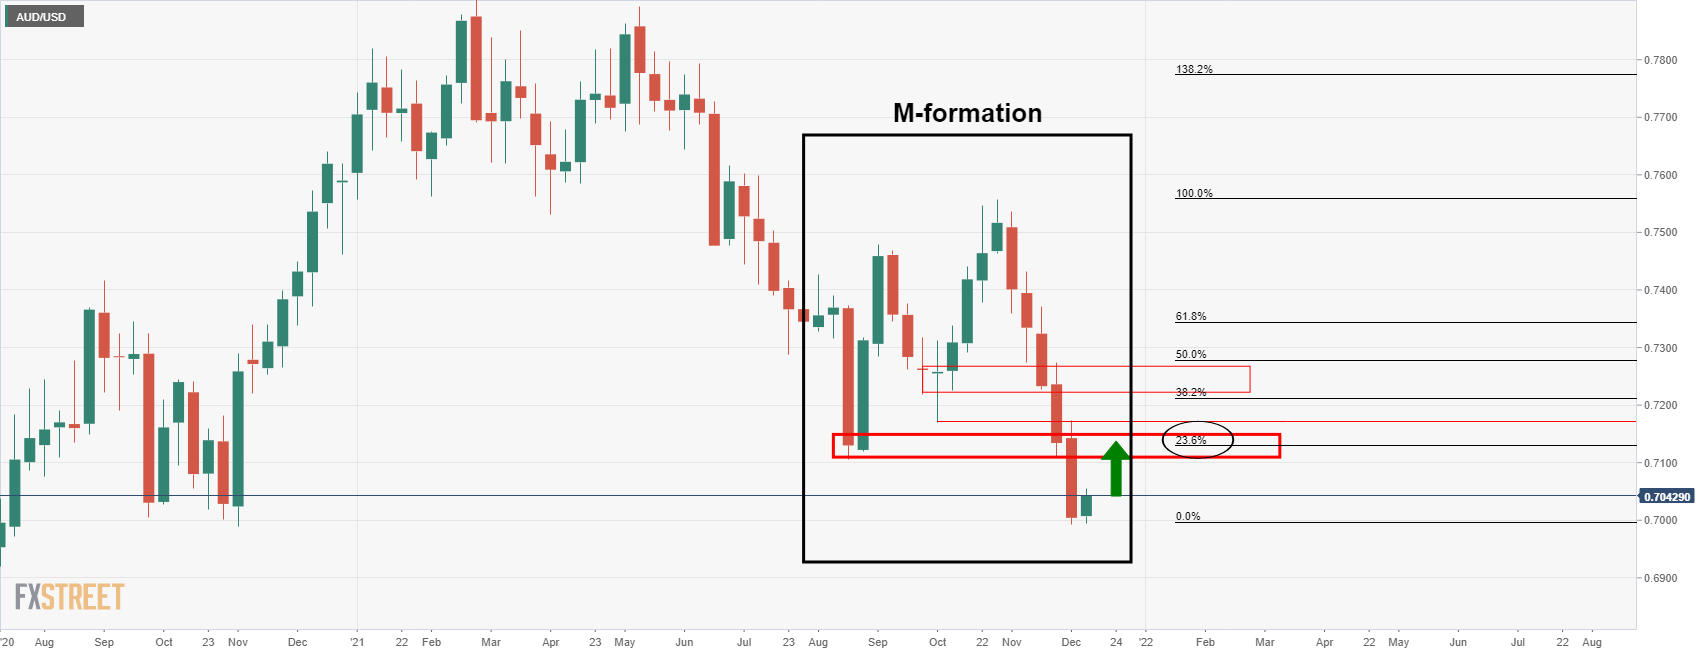
As seen, there is a structure between 0.7108/30 that the price could move into that has a confluence with the 23.6% Fibonacci retracement through 0.71 the figure near 0.7130.
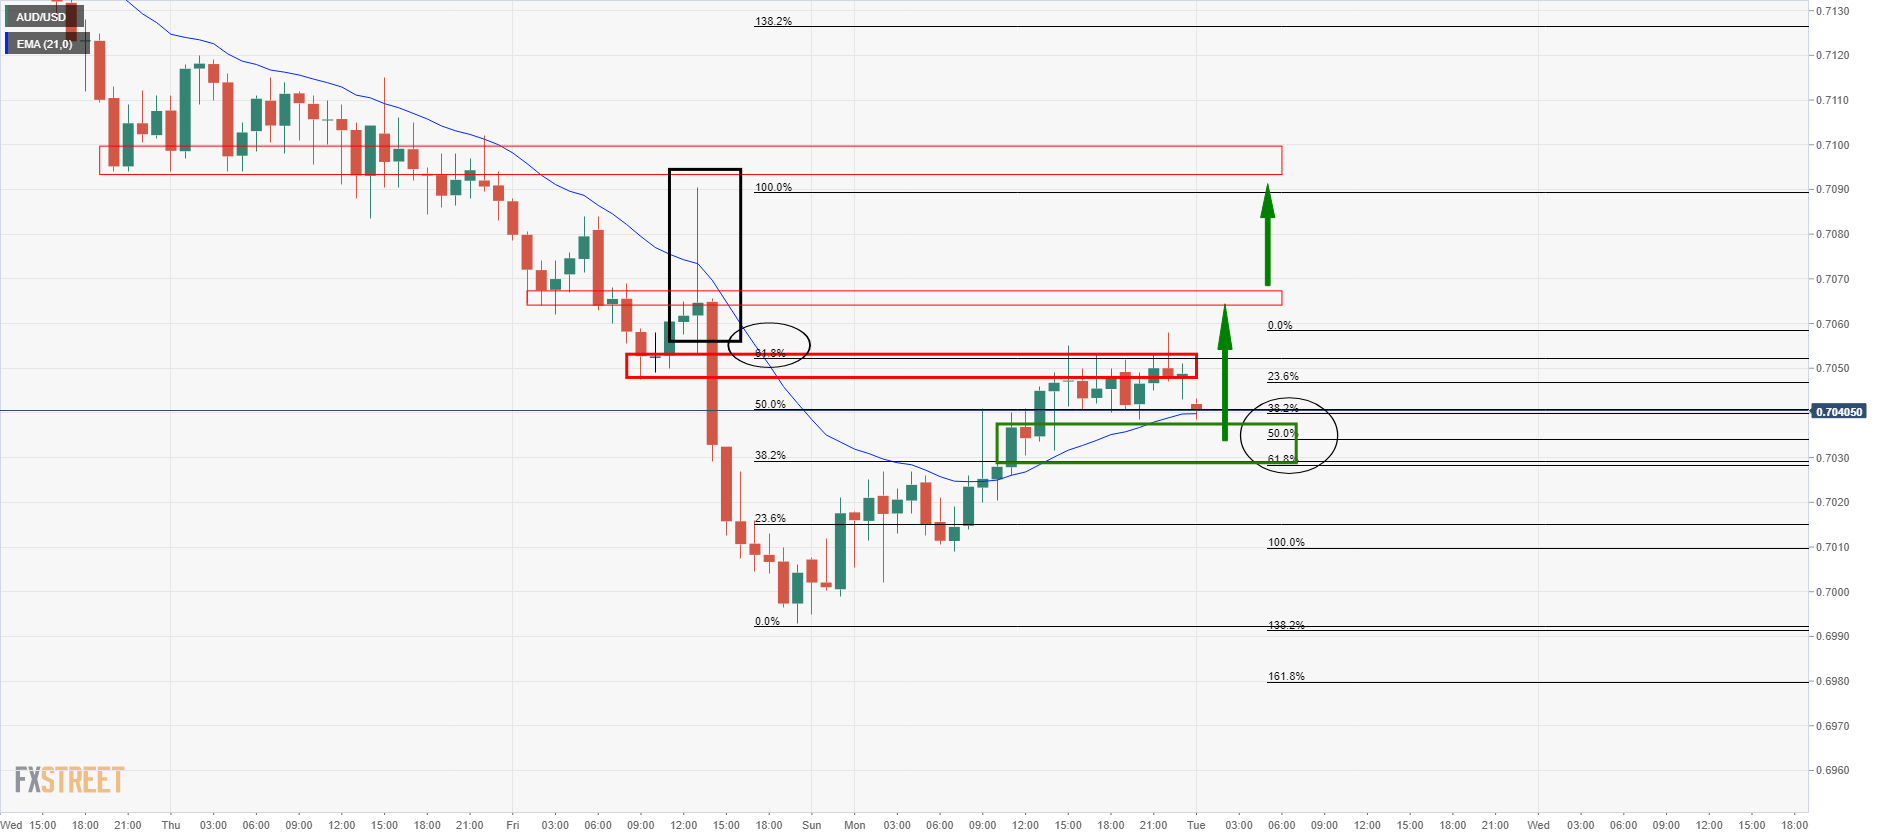
From an hourly perspective, the price has met resistance at the 61.8% Fibo of the prior hourly bearish impulse. The price is now correcting that rally to the 38.2% Fibonacci level near the 21-EMA. The support is located between here and the 61.8% of the latest bullish impulse. If this were to hold, then there are prospects of a continuation to the next layer of resistance near 0.7070. On a break of there, then there is space all the way to 0.71 the figure.
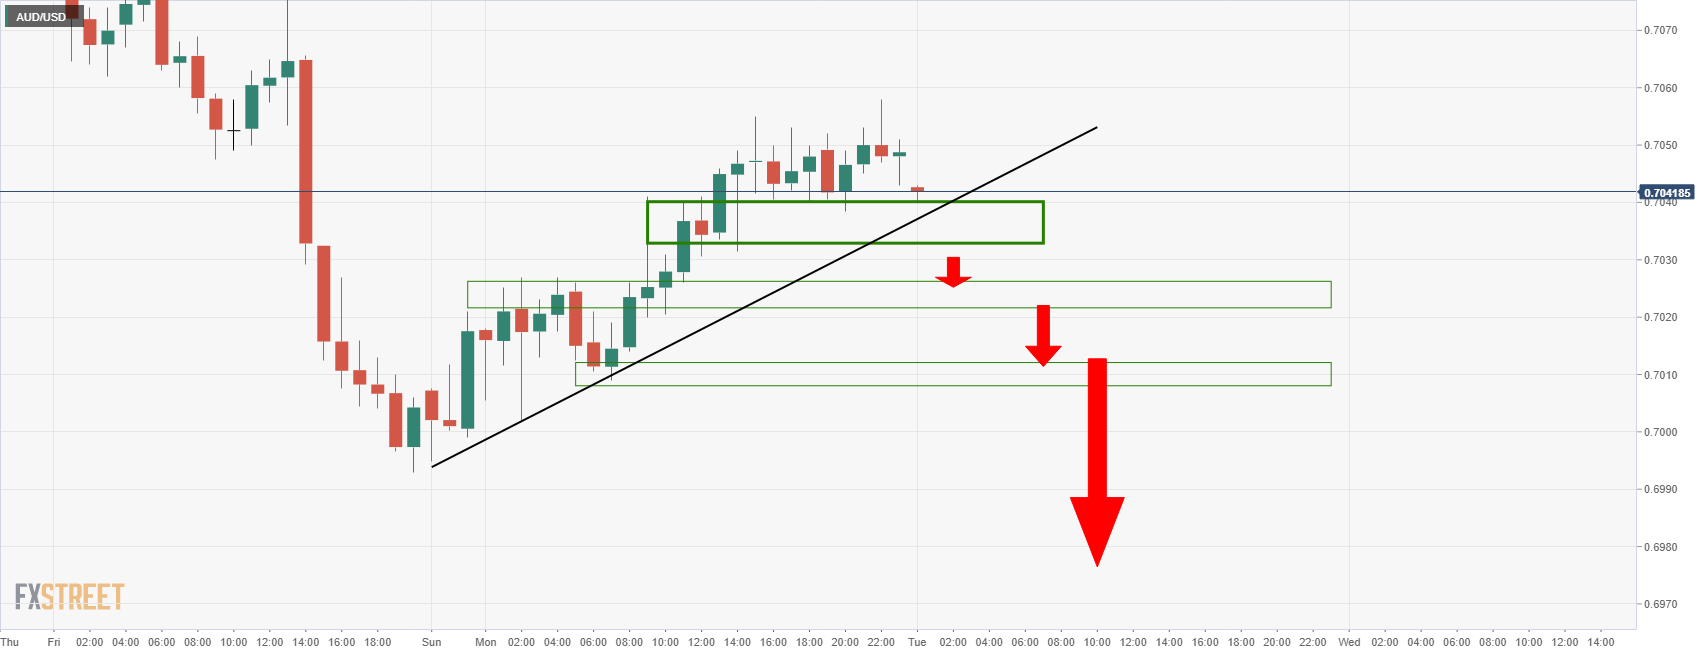
If the downside is not over, then the hourly chart's trajectory from a bearish perspective is layered with support as illustrated above. 0.7030 and 0.7010 could be levels of support that guard a breakout and a downside extension on the daily time frame:
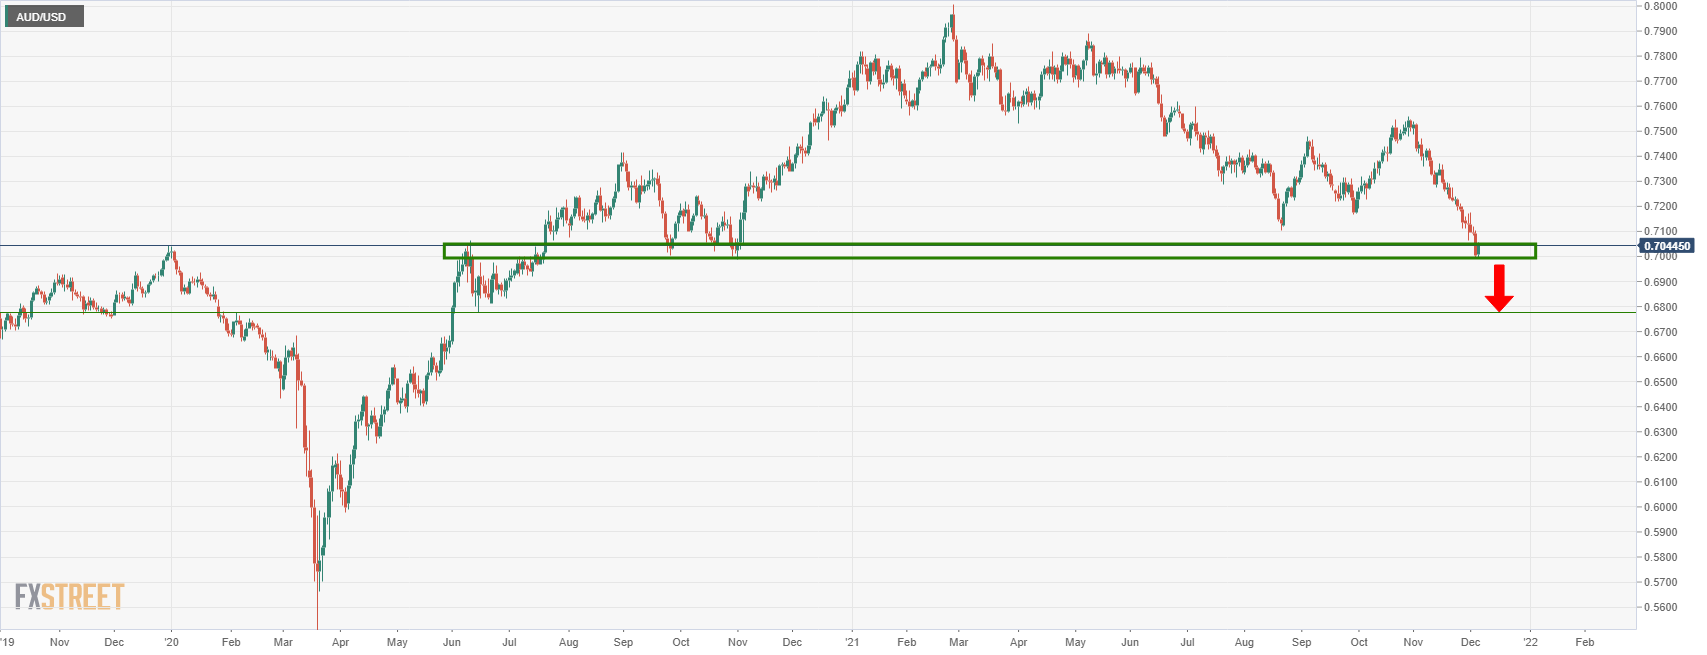
0.68 the figure could be targetted with 0.6780's acting as support below there.


