
提供最佳价差和条件
 了解更多
了解更多

EUR/USD has something for everyone in that the pair is setting up for a daily bullish continuation at first glance, however, the elephant in the room is the bearish daily W-formation and prospects of a firmer greenback.
Leaving fundamentals aside, the US dollar is correcting and following a period of accumulation, there would be prospects of a deeper correction of the recent sell-off.
The following top-down analysis illustrates the bearish bias vs the prospects of a bullish continuation in the euro.
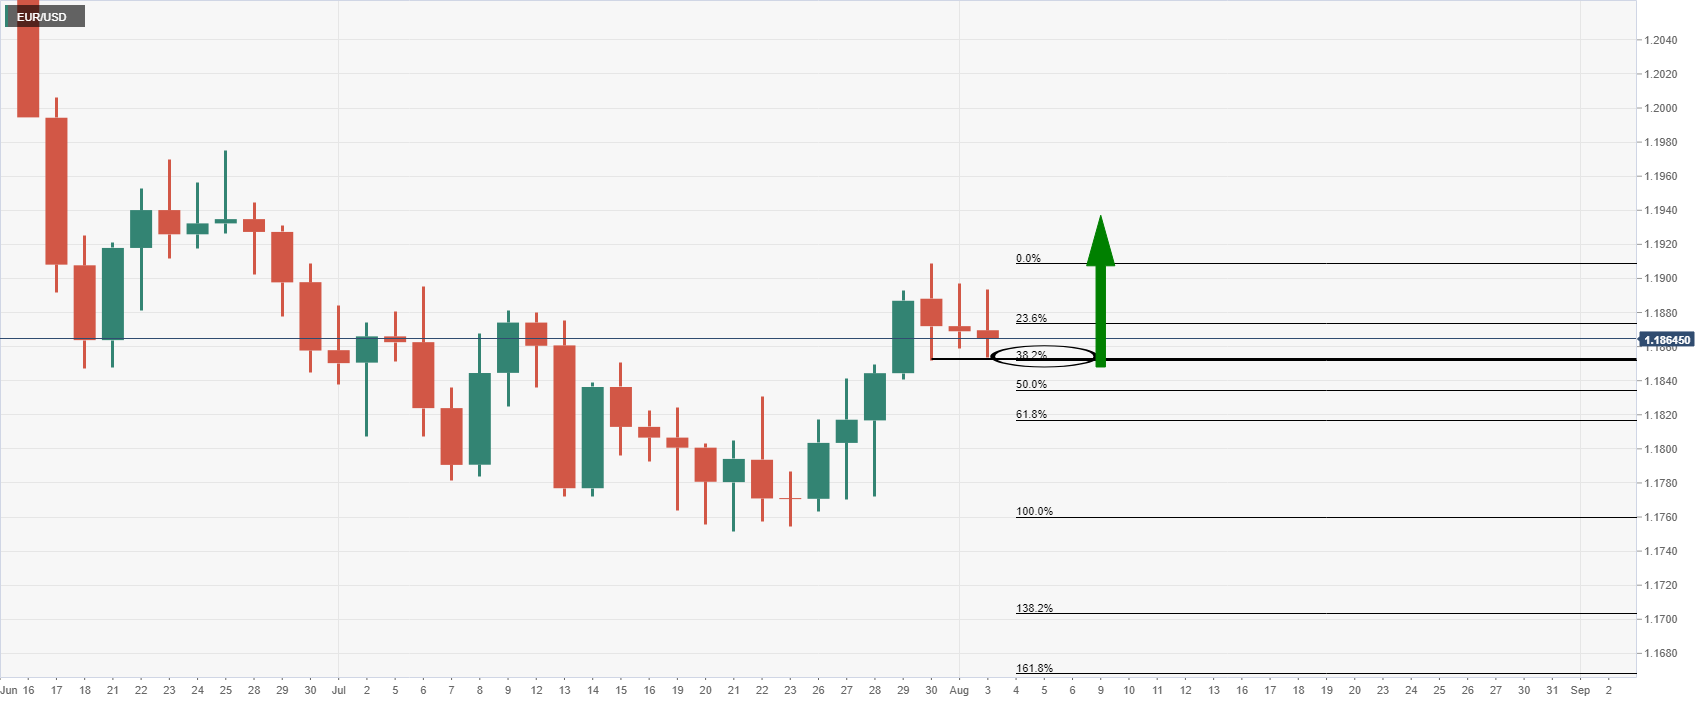
The price is starting to stabilise at a 38.2% Fibonacci retracement level and in an area of old resistance established in the first days of July.
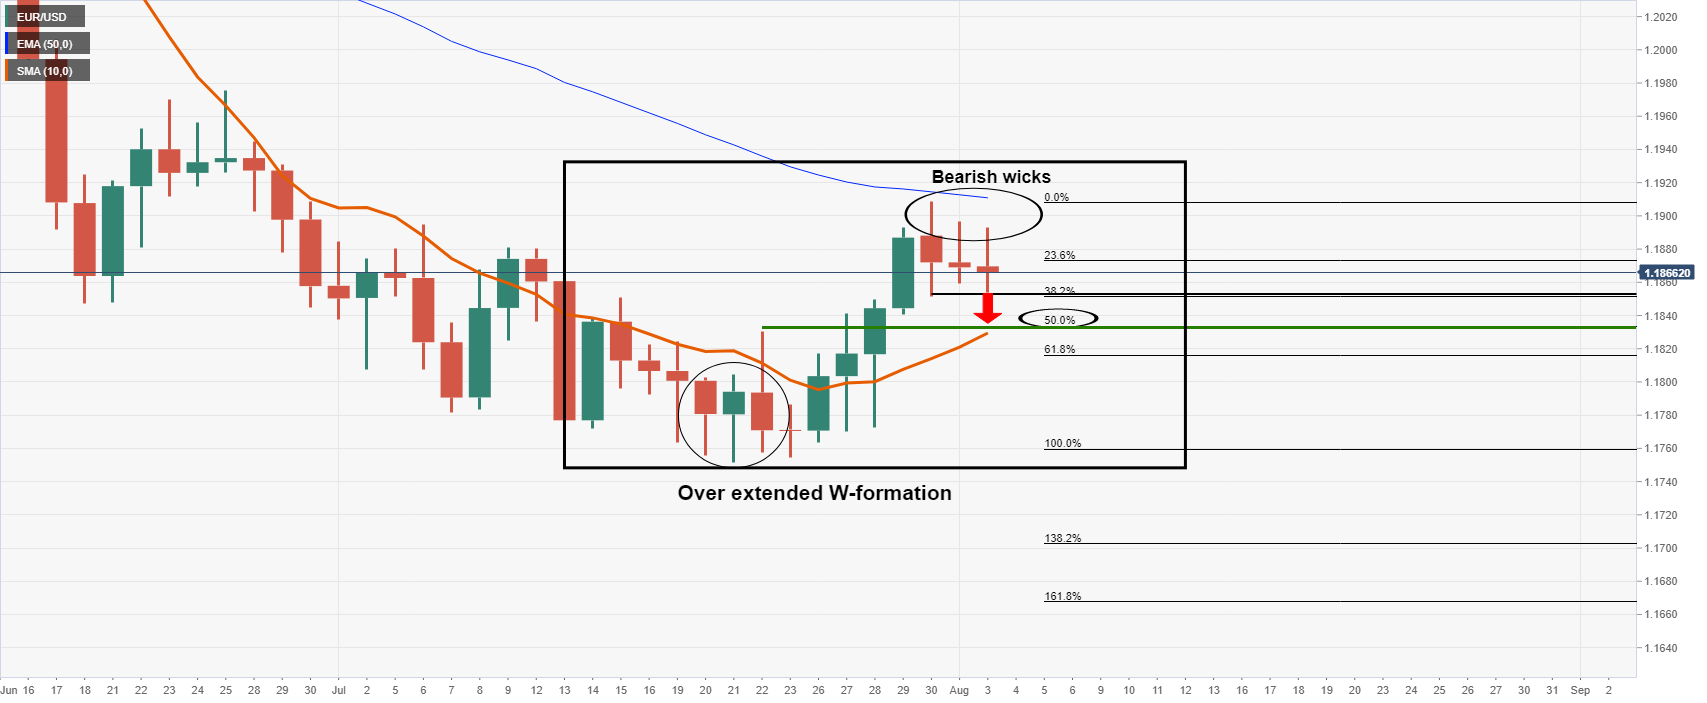
However, the W-formation is a high completion rate reversion pattern.
The theory is that the price will revert back to test the old highs of the neckline, in this case near 1.1830 which has a confluence with the 50% mean reversion Fibo as well as the 10-day EMA.
Moreover, the price has been resisted by the 50-day EMA leaving bearish wicks on three upside failures to extend higher.
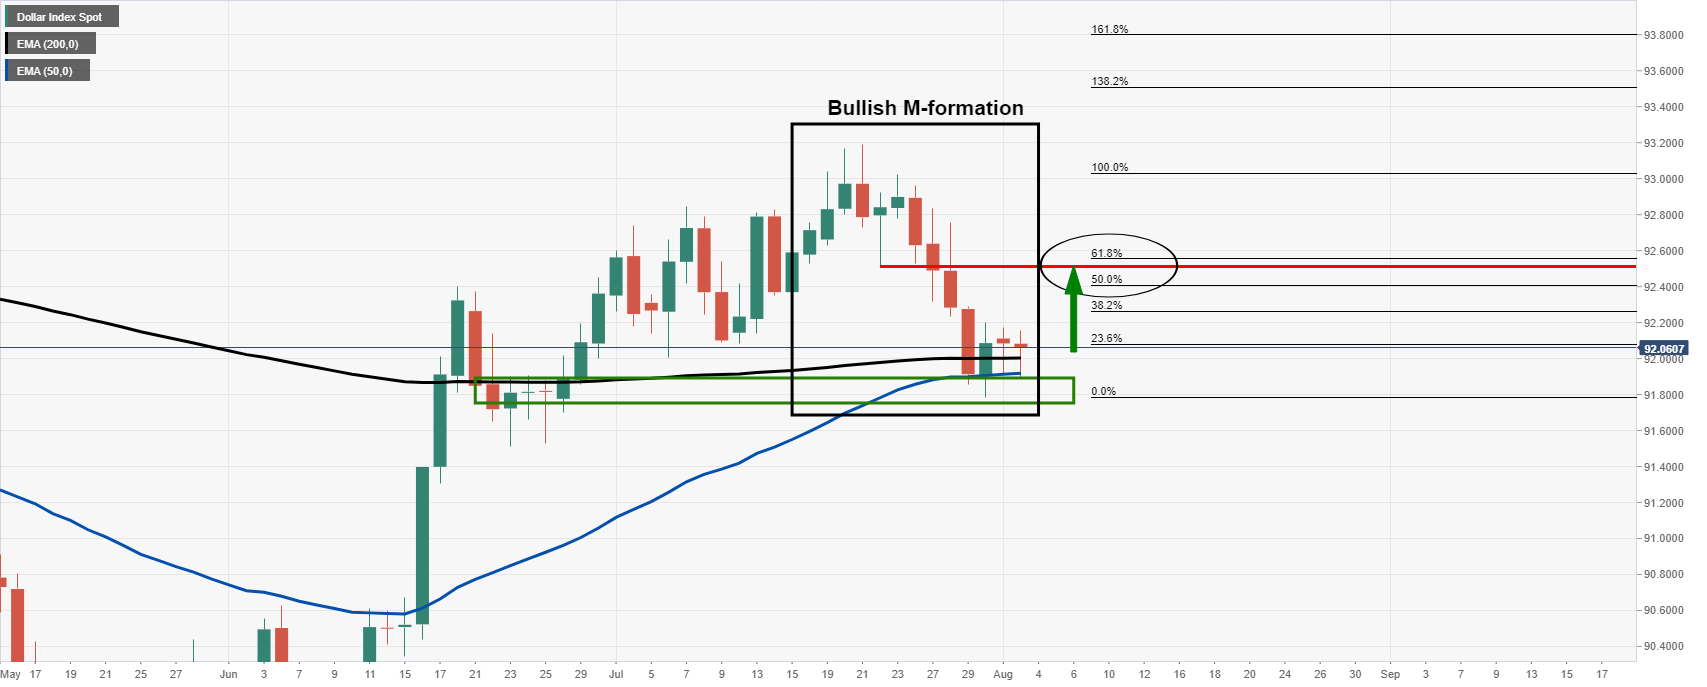
The DXY index is also constructively bullish with the convergence of the 50 and 200-day EMAs at an area of support within a bullish M-formation pattern.
The 50% and 61.8% Fibos are a compelling target area on a break of the current highs of 92.20.
Meanwhile, this opens a downside opportunity which can be monitored from a lower vantage point on both the hourly and 15-min charts as follows:
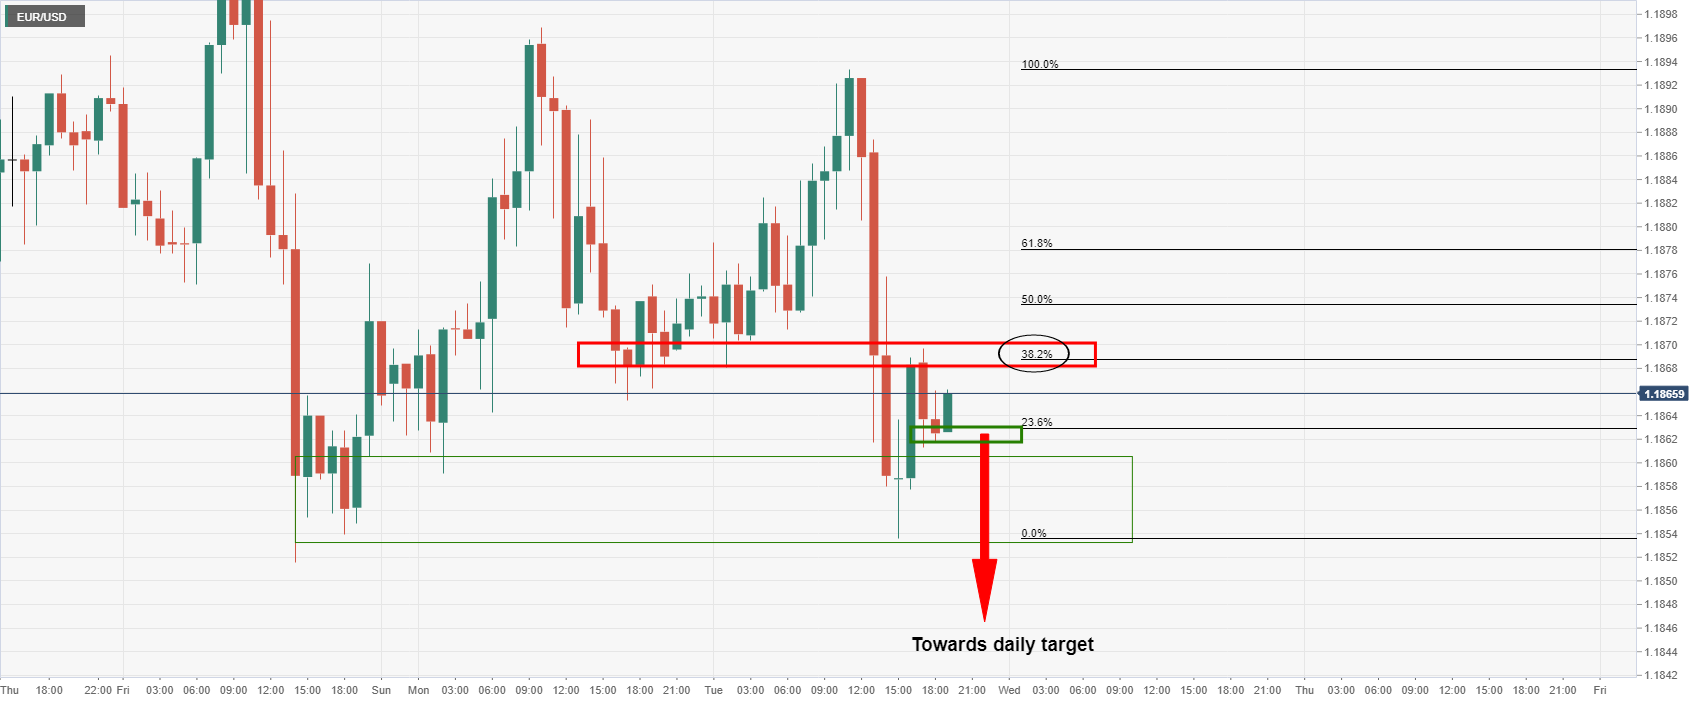
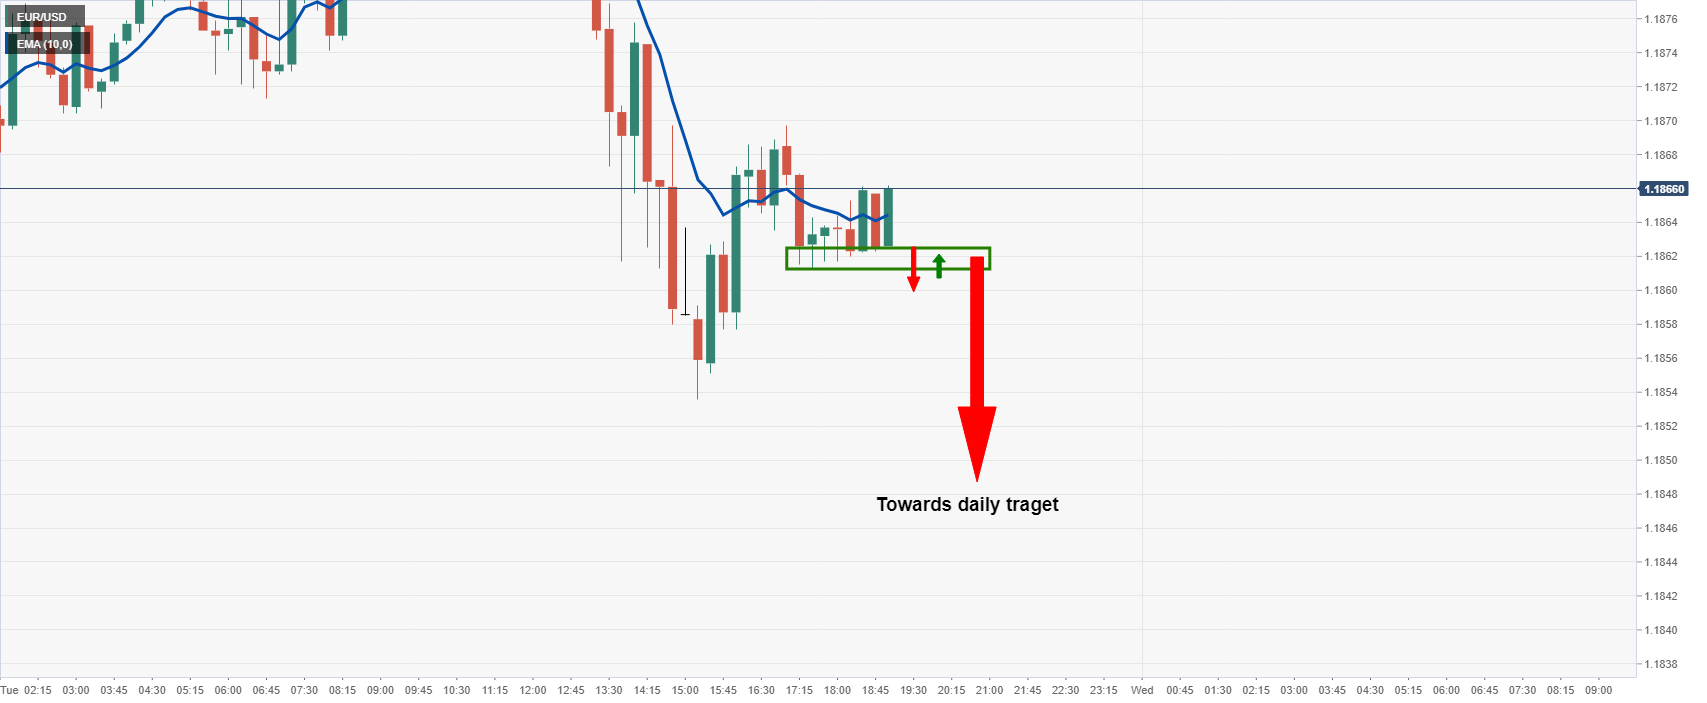
Bears will look for a break of current support near 1.1860.
This are would be then expected to act as resistance on a restest from which could offer an optimal entry point to target the daily M-formation neckline's highs near 1.1830.


