

EUR/GBP Price Analysis: Bullish falling wedge spotted, move beyond 0.8600 awaited
- EUR/GBP edged lower on Wednesday and eroded a part of the overnight strong gains.
- A combination of converging trend-line constitutes the formation of a falling wedge.
- A sustained move beyond the 0.8600 mark is needed to confirm a bullish breakout.
The EUR/GBP cross traded with a mild negative bias through the Asian session and was last seen hovering near intraday lows, around the 0.8585-80 region.
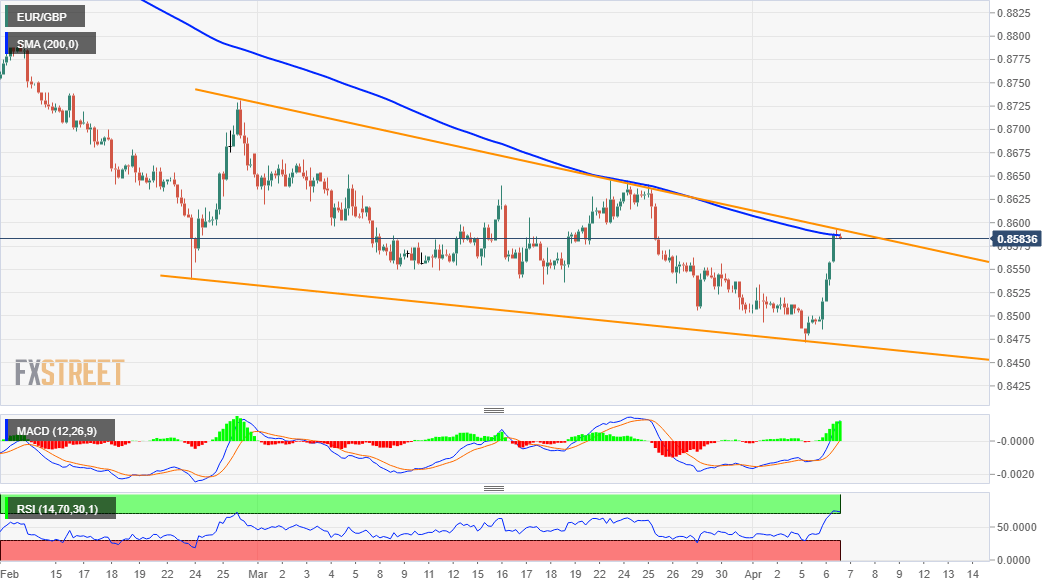
The overnight strong intraday short-covering move of over 100 pips stalled near 200-period SMA on the 4-hour chart. This is closely followed by the 0.8600 level, a resistance marked by a multi-week-old descending trend-line, which should now act as a key pivotal point for short-term traders.
The mentioned barrier, along with another downward sloping trend-line, constitutes the formation of a bullish falling wedge pattern on hourly charts. A sustained move beyond will mark a fresh bullish breakout and set the stage for further near-term recovery from 13-month lows touched on Monday.
Meanwhile, technical indicators on the daily chart – though have managed to recover a bit from the negative territory – are yet to confirm a bullish bias. Moreover, overnight RSI (14) on hourly charts further held traders from placing fresh bullish bets and capped the upside for the EUR/GBP cross.
The set-up makes it prudent to wait for a convincing break through the wedge resistance before positioning for any further appreciating move. The next relevant hurdle is pegged near the 0.8640-45 supply zone, above which the EUR/GBP cross could aim to reclaim the 0.8700 round-figure mark.
On the flip side, immediate support is pegged near the 100-period SMA on the 4-hour chart, around the 0.8560-55 region. Some follow-through selling will negate prospects for any further gains and turn the EUR/GBP cross vulnerable to accelerate the slide towards retesting the 0.8500 psychological mark.
EUR/GBP 4-hour chart
Technical levels to watch