提供最佳价差和条件
 关于平台
关于平台

The USD/CAD pair trimmed a part of its intraday gains and was last seen trading just above mid-1.2500s, up 0.25% for the day.
A goodish pickup in crude oil prices underpinned the commodity-linked loonie and capped the upside for the USD/CAD pair. This, along with the emergence of some fresh selling around the US dollar, prompted some selling at higher levels. Despite the negative factors, the pair has managed to hold well above the key 1.2500 psychological mark, or over two-week lows touched in the previous day.
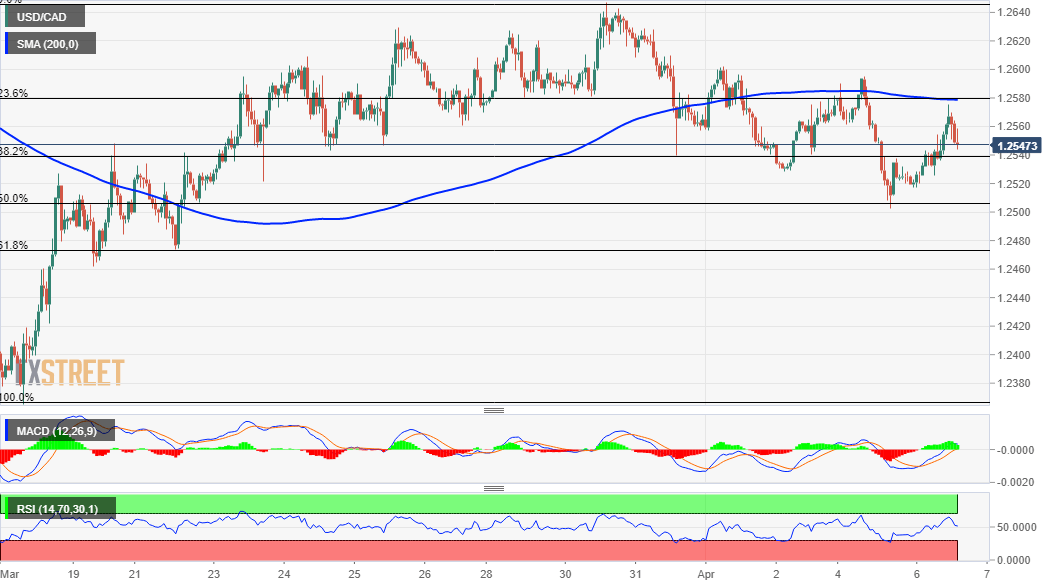
From a technical perspective, the USD/CAD pair on Monday managed to find some support near the 50% Fibonacci level of the 1.2365-1.2647 recent bounce from multi-year lows. The subsequent recovery, however, faltered near the 23.6% Fibo. level, around the 1.2575 region. This coincides with 200-hour SMA and should now act as a key pivotal point for the next leg of a directional move.
Meanwhile, technical indicators on the 1-hour chart have been gaining positive traction and support prospects for additional intraday gains. That said, oscillators on the daily chart – though have recovered from the negative territory – are yet to confirm a bullish bias. This makes it prudent to wait for a move beyond the mentioned confluence hurdle before placing fresh bullish bets.
A sustained strength above has the potential to push the USD/CAD pair further beyond the 1.2600 mark, towards testing the top boundary of a four-month-old descending channel, around the 1.2625-30 region. Some follow-through buying will mark a near-term bullish breakout and set the stage for an extension of the recent bounce from multi-year lows, around the 1.2365 region touched on March 18.
On the flip side, immediate support is pegged near the 1.2540-35 region (38.2% Fibo. level), below which the USD/CAD pair could slide back to rest the 50% Fibo. level. Failure to defend the said support levels will negate any near-term positive outlook and turn the pair vulnerable to resume it's prior/well-established downward trajectory witnessed over the past one year or so.