GBP/JPY Price Analysis: Flirts with three-day lows, just above 151.00 mark
- Break below 100-hour SMA/ascending trend-line prompted some selling around GBP/JPY.
- Bullish technical indicators on 4-hourly/daily charts warrant caution for bearish traders.
- Move beyond the 151.70-80 resistance should pave the way for further near-term gains.
The GBP/JPY cross dropped to three-day lows during the early European session, with bears now awaiting some follow-through selling below the 151.00 round-figure mark.
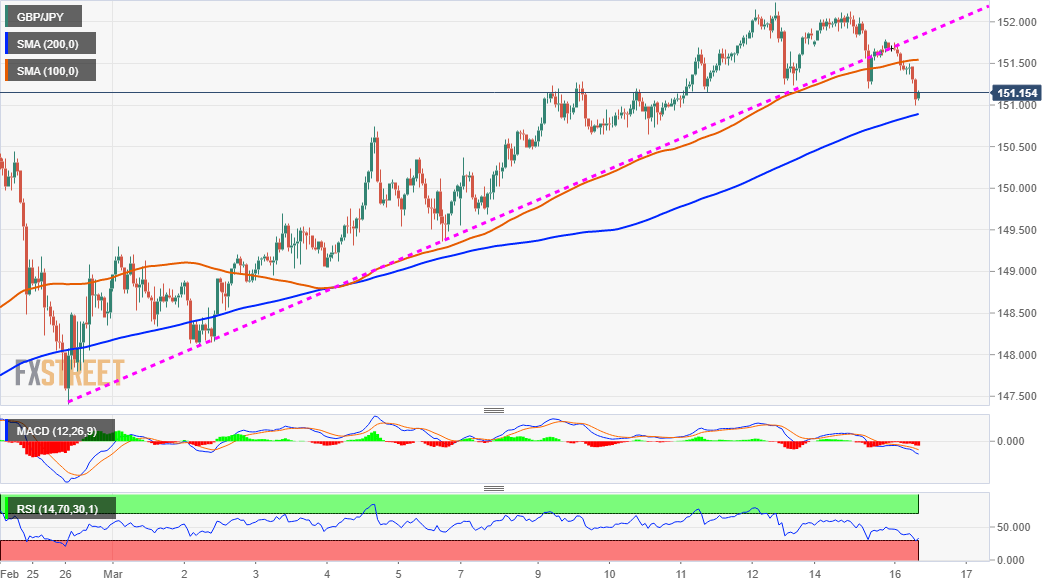
The overnight slide below confluence support near mid-151.00s was seen as a key trigger for bearish traders and prompted some follow-through selling on Tuesday. The mentioned region comprised of over two-week-old ascending trend-line and 100-hour SMA, which should now act as a key pivotal point for short-term traders.
Meanwhile, RSI (14) on the 1-hourly chart is already flashing slightly oversold conditions. Moreover, oscillators on the 4-hourly chart are still holding in the bullish territory and have eased from the overbought zone on the daily chart. This, in turn, supports prospects for the emergence of some dip-buying at lower levels.
Hence, it will be prudent to wait for some follow-through selling before confirming that the GBP/JPY cross has topped out and positioning for any meaningful corrective slide. The 200-hour SMA, around the 150.90-85 region, might protect the immediate downside, which if broken should pave the way for additional weakness.
The GBP/JPY cross might then accelerate the downfall towards challenging the key 150.00 psychological mark. The momentum could further get extended towards the next relevant support near the 149.70-65 horizontal zone.
On the flip side, the mentioned confluence support breakpoint now seems to act as immediate strong resistance. This is closely followed by the recent daily closing highs near the 150.70-80 region. A sustained move beyond will negate any near-term bearish bias and set the stage for an extension of the recent strong upward trajectory.
GBP/JPY 1-hourly chart
Technical levels to watch