
提供最佳价差和条件
 关于平台
关于平台

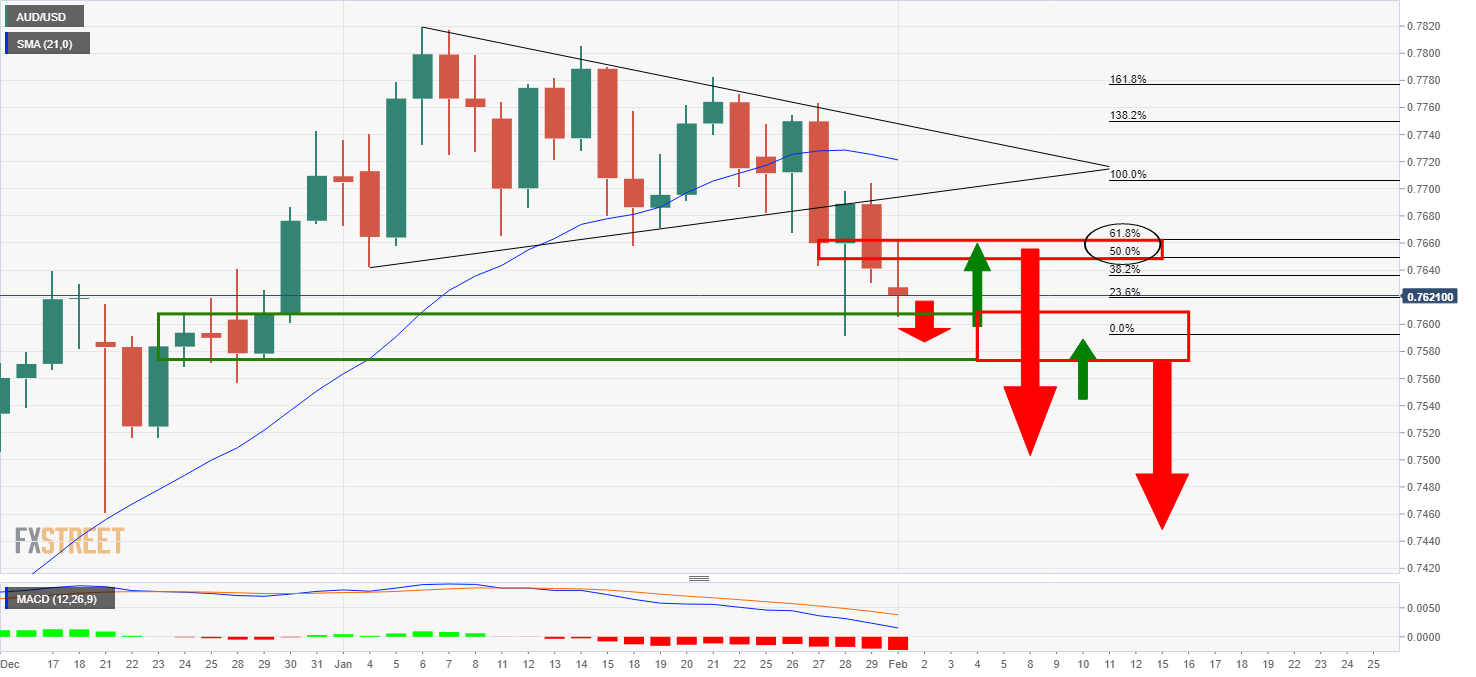
AUD/USD is correcting from a monthly top formed in December of last year but is showing signs of stabilisation since falling out of the symmetrical triangle to the downside.
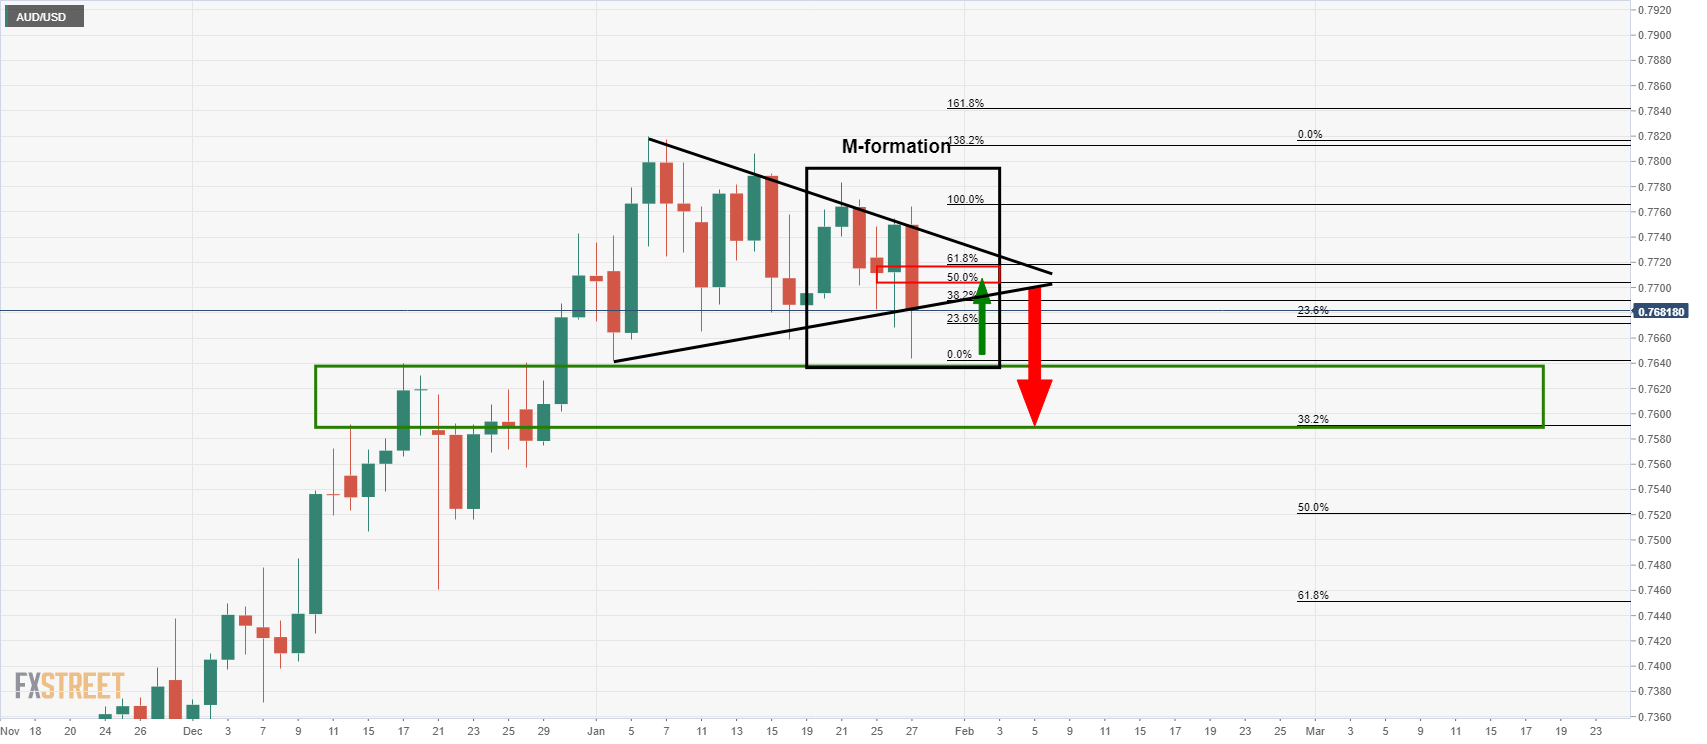
In a prior analysis, the M-formation had been identified within the symmetrical triangle and it was illustrated that a retest of the 50% mean reversion area which meets the neckline of the formation was on the cards.
The expectations are for a downside continuation below triangle's dynamic support following the retest, but there are caveats to the bias.
Meanwhile, the following is a top-down analysis that combines the CFTC data with the spot market.
Net AUD positions have held in positive territory for the third week but were pared back in the week ending 26 January by around 3% of open interest.
This fits in with the corrective bullish narrative surrounding the greenback in recent times but doesn't necessarily mean the market is shifting its bias towards a bearish Aussie.
Only 534 shorts were added.
Fundamentally, however, ''China/Australian tensions and the Reserve Bank of Australia’s QE policy could temper the attraction of the AUD going forward'', analysts at Rabobank argued.
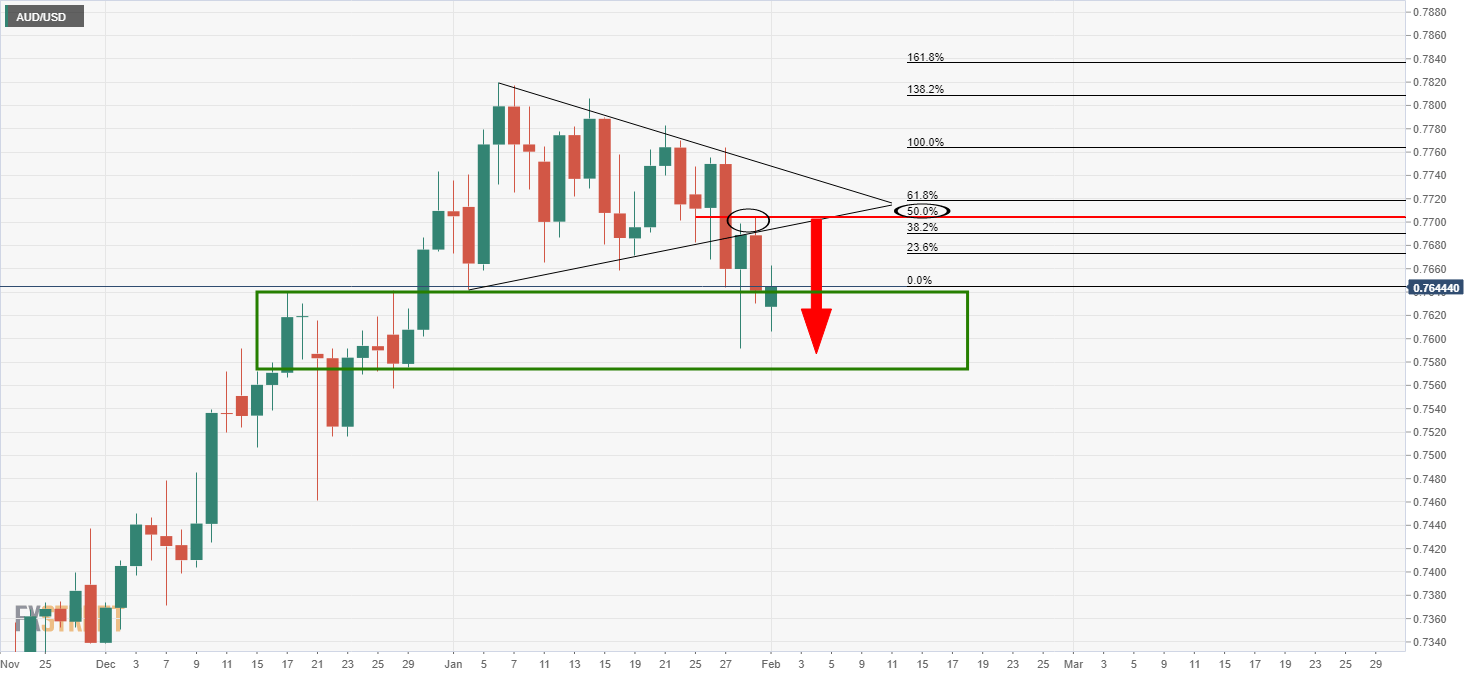
The weekly chart shows that the price has made a lower low but there is an M-formation for which could see the price retest old support with a thorough bid prior to extending the downside.
Only a break of the current support will enable the price to move freely lower into the demand territory and potentially onwards towards the monthly support zone.
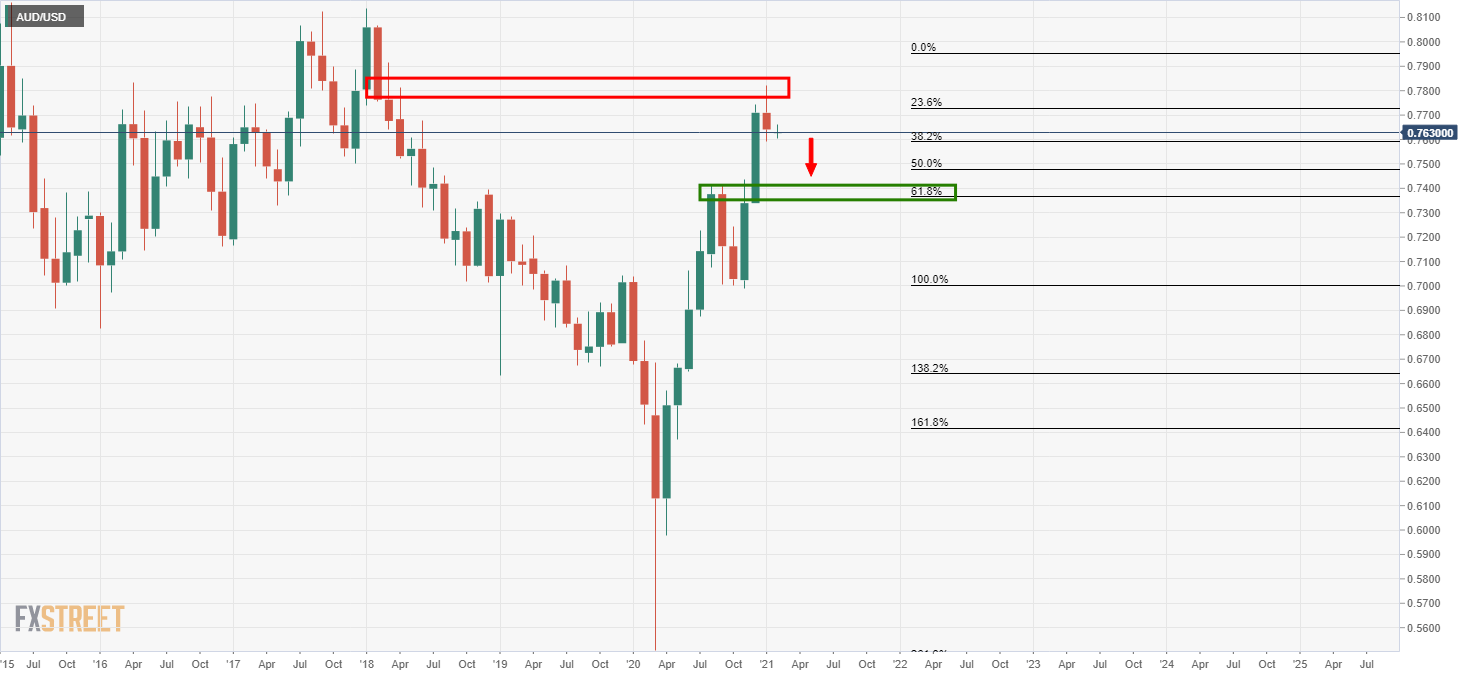
The market is in bearish conditions according to the technical indicators (albeit lagging).
The price can easily move to the upside from support.
Presuming that there is some further deterioration in the price, a restest of what would be a confluence of the prior support, now acting as resistance, and deep Fibonaccis could be the catalysts for the next bearish impulse.
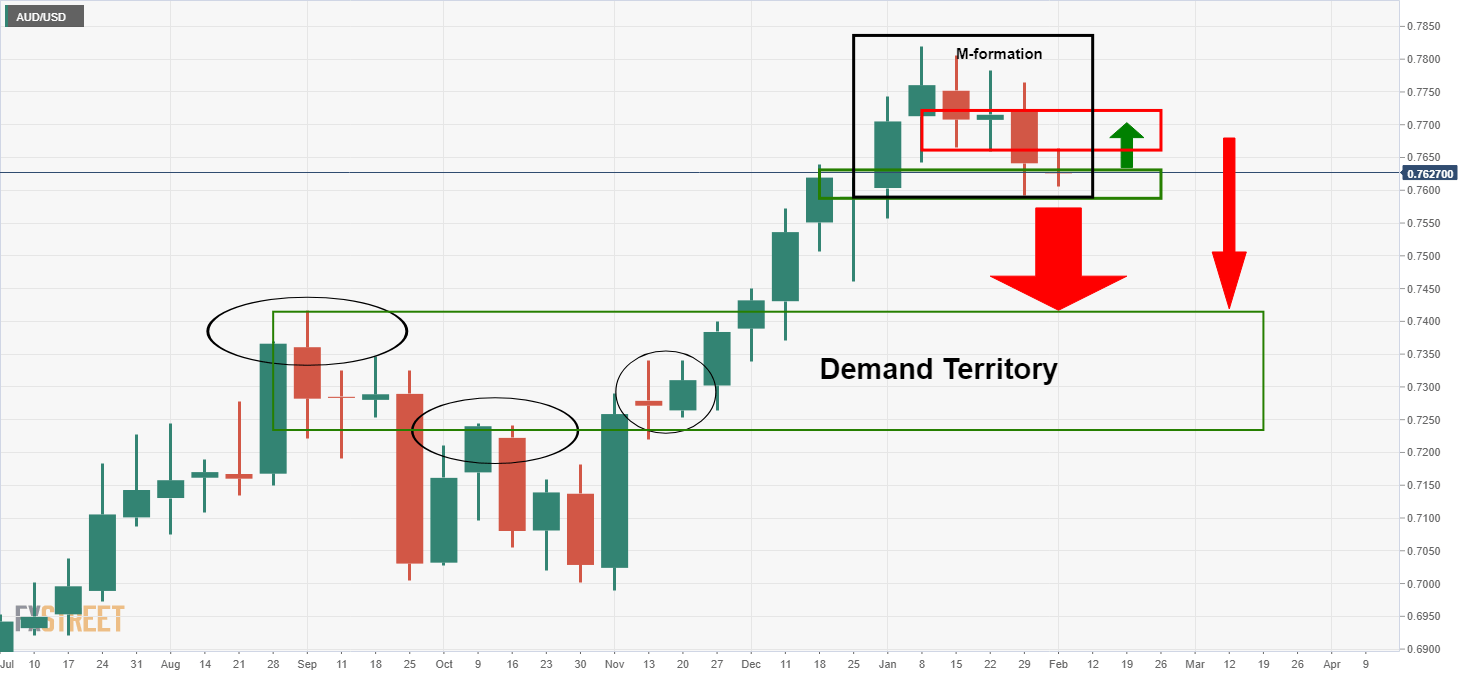
Unless there is a highly bearish structure formed above current support, bears, however, will be prudent to wait for confirmation of the downside bias.
This will come once the support structure is well and truly broken which would be expected to then act as resistance on a restest.
This would then solidify the higher probability and prospects of a deep correction into the monthly demand zone.


