

AUD/USD Price Analysis: Solid support at 0.71 opens door to two higher targets – Confluence Detector
AUD/USD surged on Tuesday as the dollar lost ground amid coronavirus vaccine hopes and as the A$ ignored the worsening COVID-19 situation in Melbourne. How is Aussie/USD positioned on the charts?
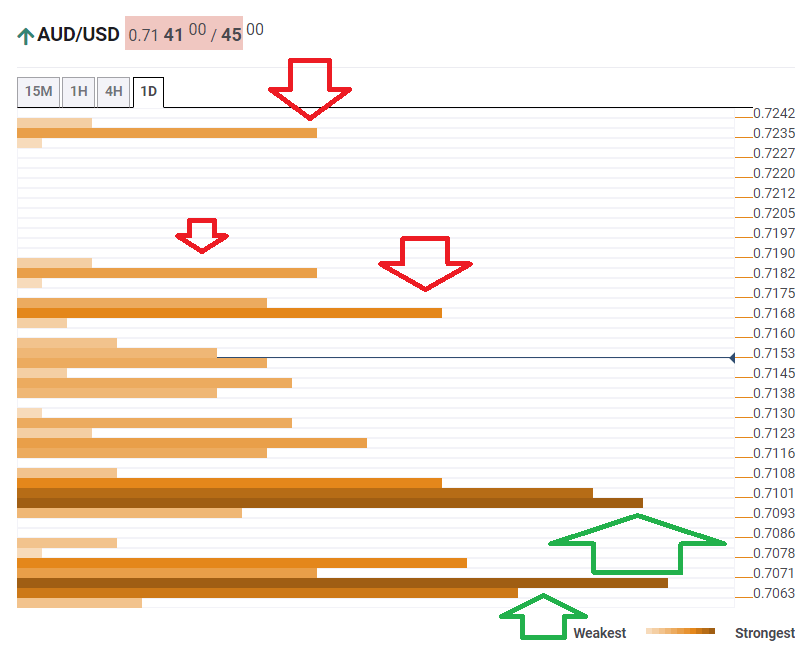
The Technical Confluences Indicator is showing that AUD/USD has solid support at around 0.71, which is a dense cluster of lines including the Fibonacci 38.2% one-day, the Pivot Point one-month Resistance 1, the PP one-week R2, and the Simple Moving Average 100-15m.
It is backed by 0.7067, which is the convergence of the previous monthly high, the Fibonacci 61.8% one-day, the SMA 10-4h, and the Bollinger Band one-day Upper.
Looking up, the first upside target is 0.7168, which is the meeting point of the BB 1h-Upper and the PP one-week R3. It is followed by 0.7182, which is where the PP one-day R1 hits the price.
Further above, AUD/USD may eye 0.7229, which is where the PP one-day R2 is seen.
Here is how it looks on the tool:
Confluence Detector
The Confluence Detector finds exciting opportunities using Technical Confluences. The TC is a tool to locate and point out those price levels where there is a congestion of indicators, moving averages, Fibonacci levels, Pivot Points, etc. Knowing where these congestion points are located is very useful for the trader, and can be used as a basis for different strategies.
This tool assigns a certain amount of “weight” to each indicator, and this “weight” can influence adjacents price levels. These weightings mean that one price level without any indicator or moving average but under the influence of two “strongly weighted” levels accumulate more resistance than their neighbors. In these cases, the tool signals resistance in apparently empty areas.
Learn more about Technical Confluence