

EUR/USD recovery in jeopardy amid several significant resistance lines – Confluence Detector
EUR/USD has been attempting a recovery after the Federal Reserve slashed interest rates to zero in an emergency decision amid the coronavirus crisis. However, the world's most popular currency pair may find it hard to further advance.
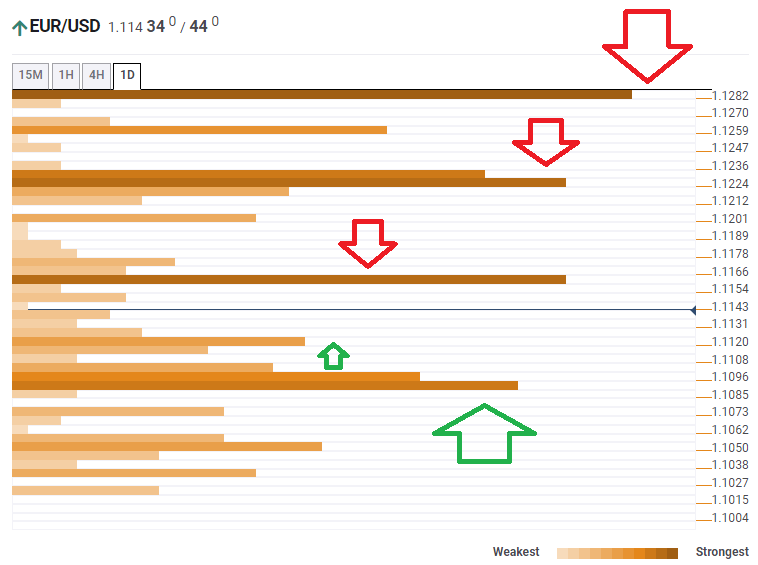
The Technical Confluences Indicator is showing that EUR/USD is capped at 1.1160, which is the convergence of the Fibonacci 61.8% one-day and the Fibonacci 23.6% one-week.
Next, it is capped by 1.1224, which is a juncture of lines including the previous daily high, the Fibonacci 38.2% one-week, and the 100-day Simple Moving Average.
Further up, EUR/USD is capped at 1.1282, where the Pivot Point one-month Resistance 2 hits the price.
Some support awaits at 1.1120, which is the confluence of the Bollinger Band 15min-Middle, the SMA 5-1h, and the Fibonacci 38.2% one-day.
More significant support is at 1.1096, which is the meeting point of the Fibonacci 23.6% one-day, the previous monthly high, and the 200-day SMA.
Here is how it looks on the tool:
Confluence Detector
The Confluence Detector finds exciting opportunities using Technical Confluences. The TC is a tool to locate and point out those price levels where there is a congestion of indicators, moving averages, Fibonacci levels, Pivot Points, etc. Knowing where these congestion points are located is very useful for the trader, and can be used as a basis for different strategies.
This tool assigns a certain amount of “weight” to each indicator, and this “weight” can influence adjacents price levels. These weightings mean that one price level without any indicator or moving average but under the influence of two “strongly weighted” levels accumulate more resistance than their neighbors. In these cases, the tool signals resistance in apparently empty areas.
Learn more about Technical Confluence