Back
27 Feb 2020
USD/INR New York Price Analysis: Dollar bears pressuring 71.60 support vs. rupee
- USD/INR is trapped in a range market while the market is easing from February tops.
- The level to beat for sellers is the 71.60 support.
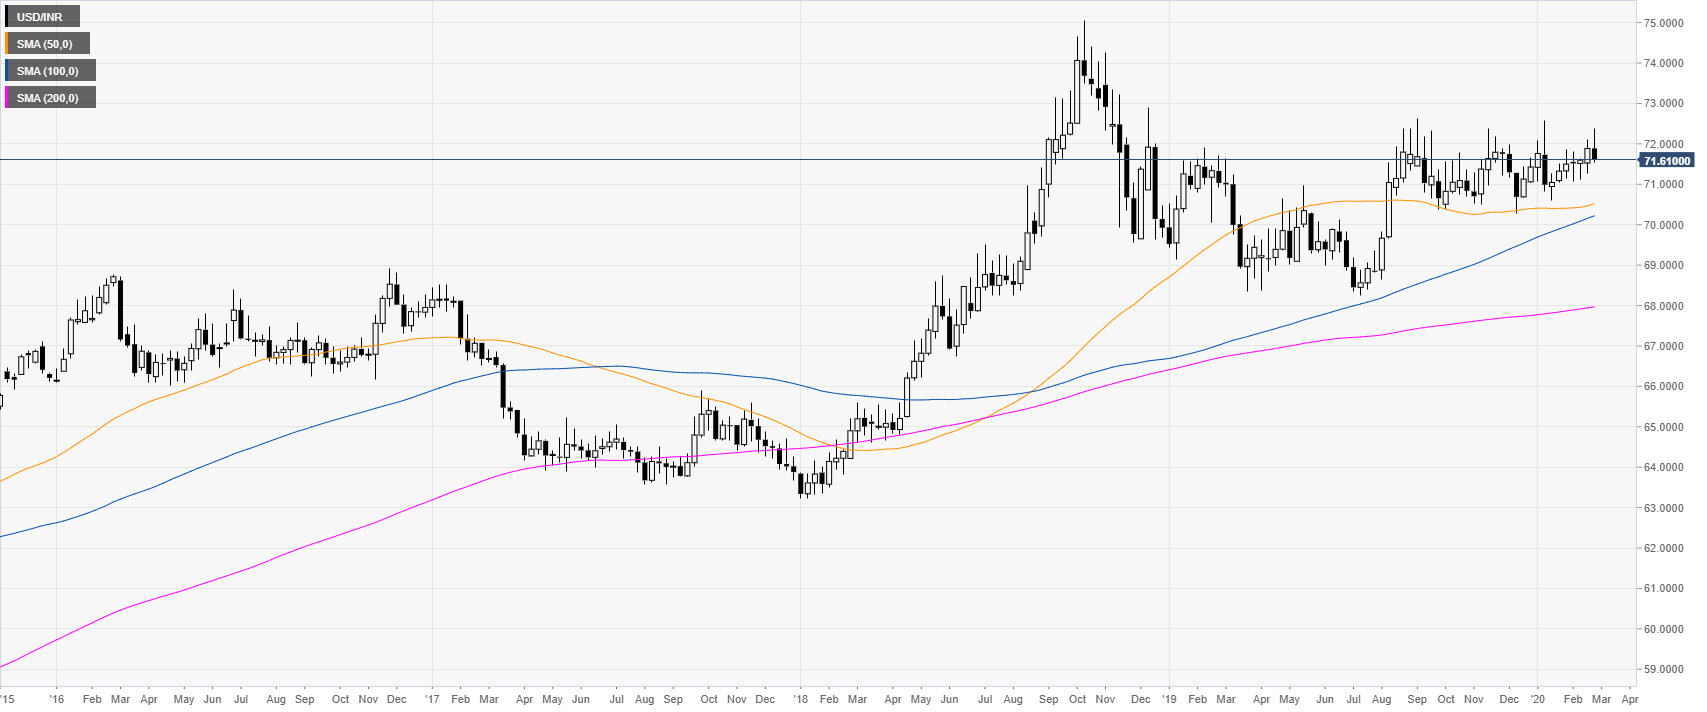
USD/INR weekly chart
Following the 2018 bull-market, USD/INR has been consolidating in a rectangle formation. The quote is trading above its main weekly simple moving averages (SMAs), suggesting a bullish momentum in the long term.
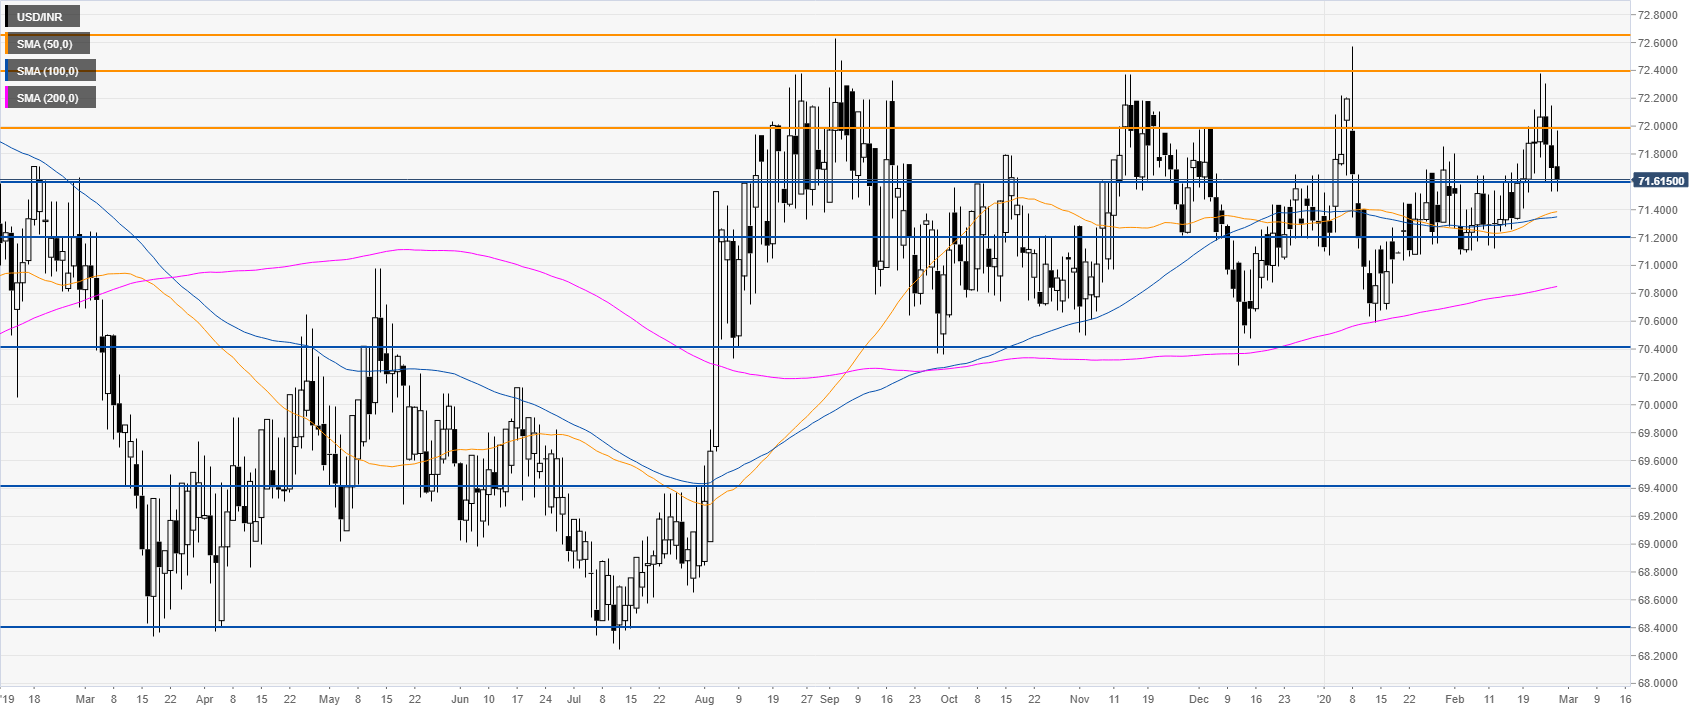
USD/INR daily chart
The spot is retracing down from the 72.40 resistance while retracing from February tops. USD/INR is trapped in a sideways market as bears are pressuring the 71.60 support en route towards the 71.20 level in the medium term.
Additional key levels