

Gold Price Analysis: Eyeing $1,612, $1,620 as next bullish levels amid coronavirus fears – Confluence Detector
Coronavirus fears continue underpinning gold prices. While China has announced measures to help the economy, fears of growing economic damage, XAU/USD is holding onto gains above $1,600. What are the next levels to watch?
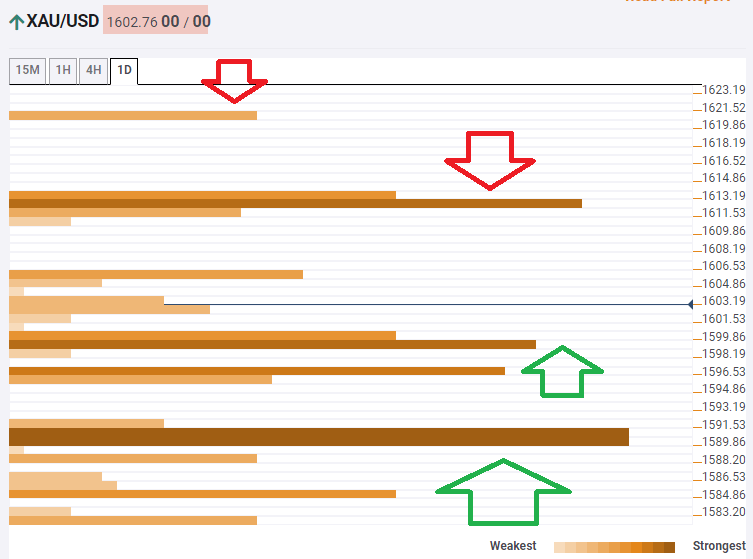
The Technical Confluences Indicator is showing that significant resistance awaits at $1,612, which is the convergence of the multi-year high, the Pivot Point one-day Resistance 1, the PP one-week R3, and the Bollinger Band 1h-Upper.
Further above, the upside target is $1,620, which is where the Pivot Point one-day Resistance 2 hits the price.
Looking down, substantial support is at $1,599, which is the confluence of the Fibonacci 23.6% one-day, the previous 4h-low, the Simple Moving Average 5-4h, the PP one-week R2, and more.
Further down, a considerable cushion awaits gold prices at $1,594, which is a juncture including the Fibonacci 61.8% one-day, the PP one-week R1, the SMA 5-1h, and the Fibonacci 23.6% one-month.
Here is how it looks on the tool:
Confluence Detector
The Confluence Detector finds exciting opportunities using Technical Confluences. The TC is a tool to locate and point out those price levels where there is a congestion of indicators, moving averages, Fibonacci levels, Pivot Points, etc. Knowing where these congestion points are located is very useful for the trader, and can be used as a basis for different strategies.
This tool assigns a certain amount of “weight” to each indicator, and this “weight” can influence adjacents price levels. These weightings mean that one price level without any indicator or moving average but under the influence of two “strongly weighted” levels accumulate more resistance than their neighbors. In these cases, the tool signals resistance in apparently empty areas.
Learn more about Technical Confluence