WTI Price Analysis: Takes a U-turn from 61.8% Fibonacci on renewed risk-off
- WTI snaps two-day advances while slipping below an ascending trend line from Tuesday.
- 200-hour SMA can be considered returning to the charts amid bearish MACD.
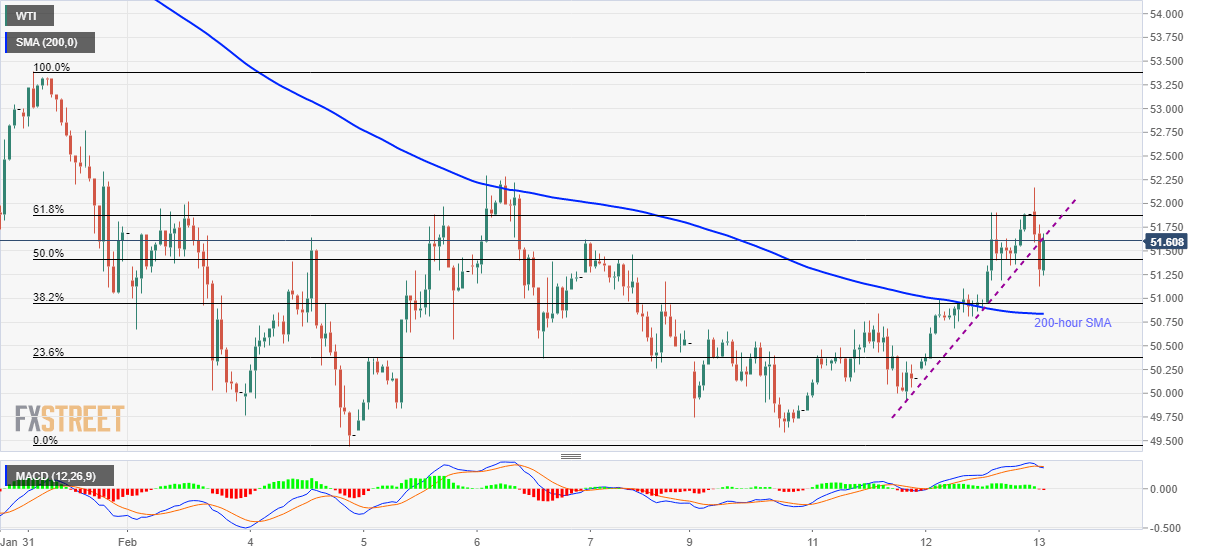
WTI trades near $51.55, following the intra-day low to $51.12, during the Asian session on Thursday. In doing so, the black gold marks its reversal from 61.8% Fibonacci retracement of its declines between January 31 and February 04.
The energy benchmark recently responded to the sharp increase in coronavirus cases from China’s Hubei whereas calls to limit US President Donald Trump’s powers to go on a war with Iran weighed on the quote previously.
Read: Breaking: Coronavirus update killing risk assets, AUD/JPY -0.66% in a heartbeat
That said, bearish MACD and a clear break of short-term rising support line drag the quote presently towards a 200-hour SMA level of $50.80. Though, further declines in oil prices will depend on how well it can stay below $50.00 round-figure.
On the contrary, sustained trading beyond 61.8% Fibonacci retracement level of $51.90 can take aim at the monthly top near $52.30.
In a case where the benchmark grows beyond $52.30, January-end high around $53.40 will be in focus.
WTI hourly chart
Trend: Pullback expected