Back
4 Feb 2020
USD/INR New York Price Forecast: Greenback challenging 71.20 support vs. rupee
- USD/INR’s bear flag could drive the price down.
- The level to beat for sellers is the 71.20 level.
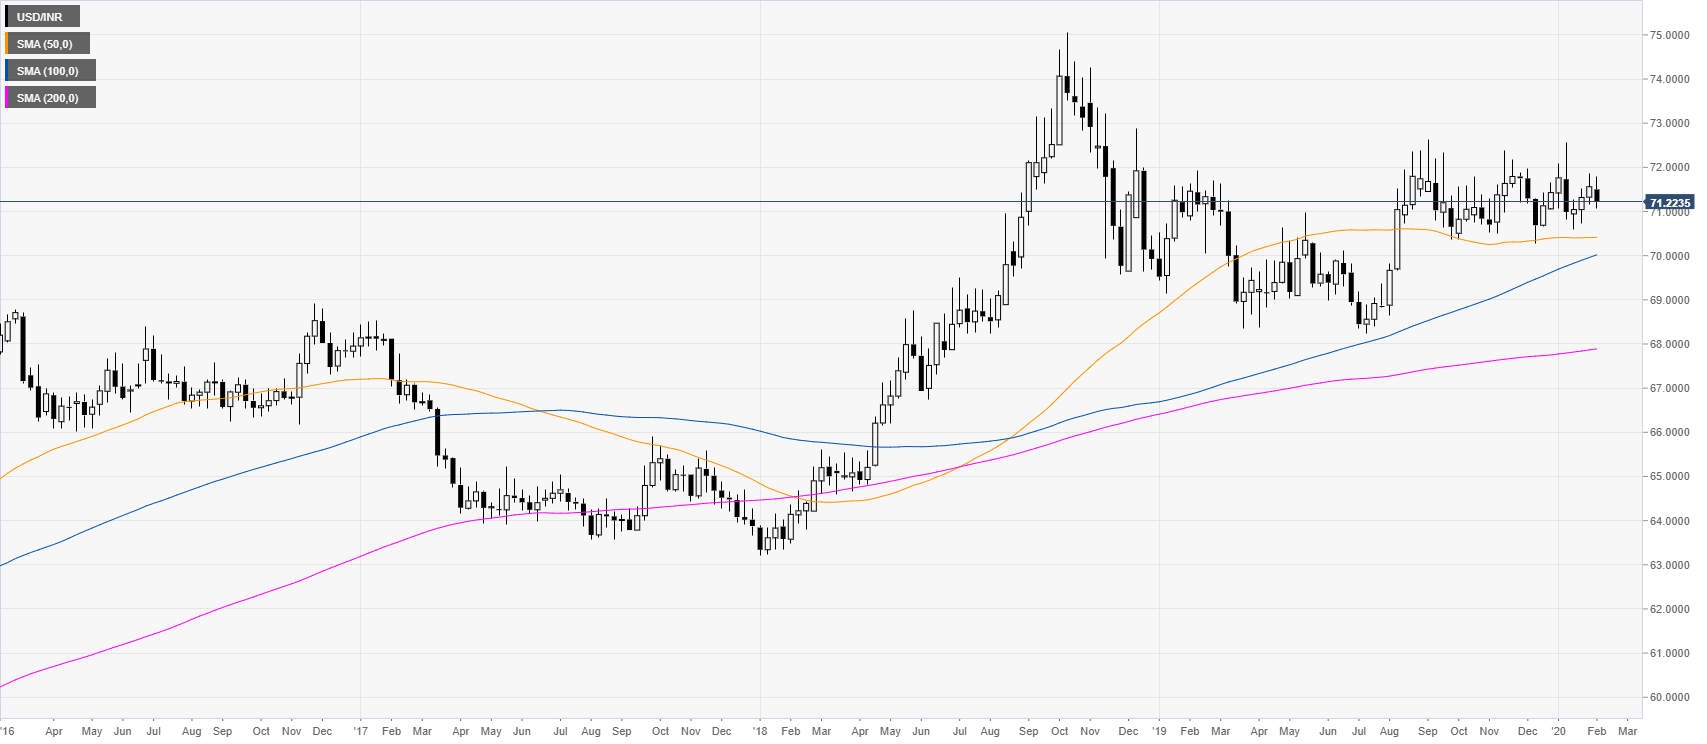
USD/INR weekly chart
The market is trading above the main weekly simple moving averages (SMAs). After the 2018 bull market, USD/INR has been consolidating in a rectangle formation.
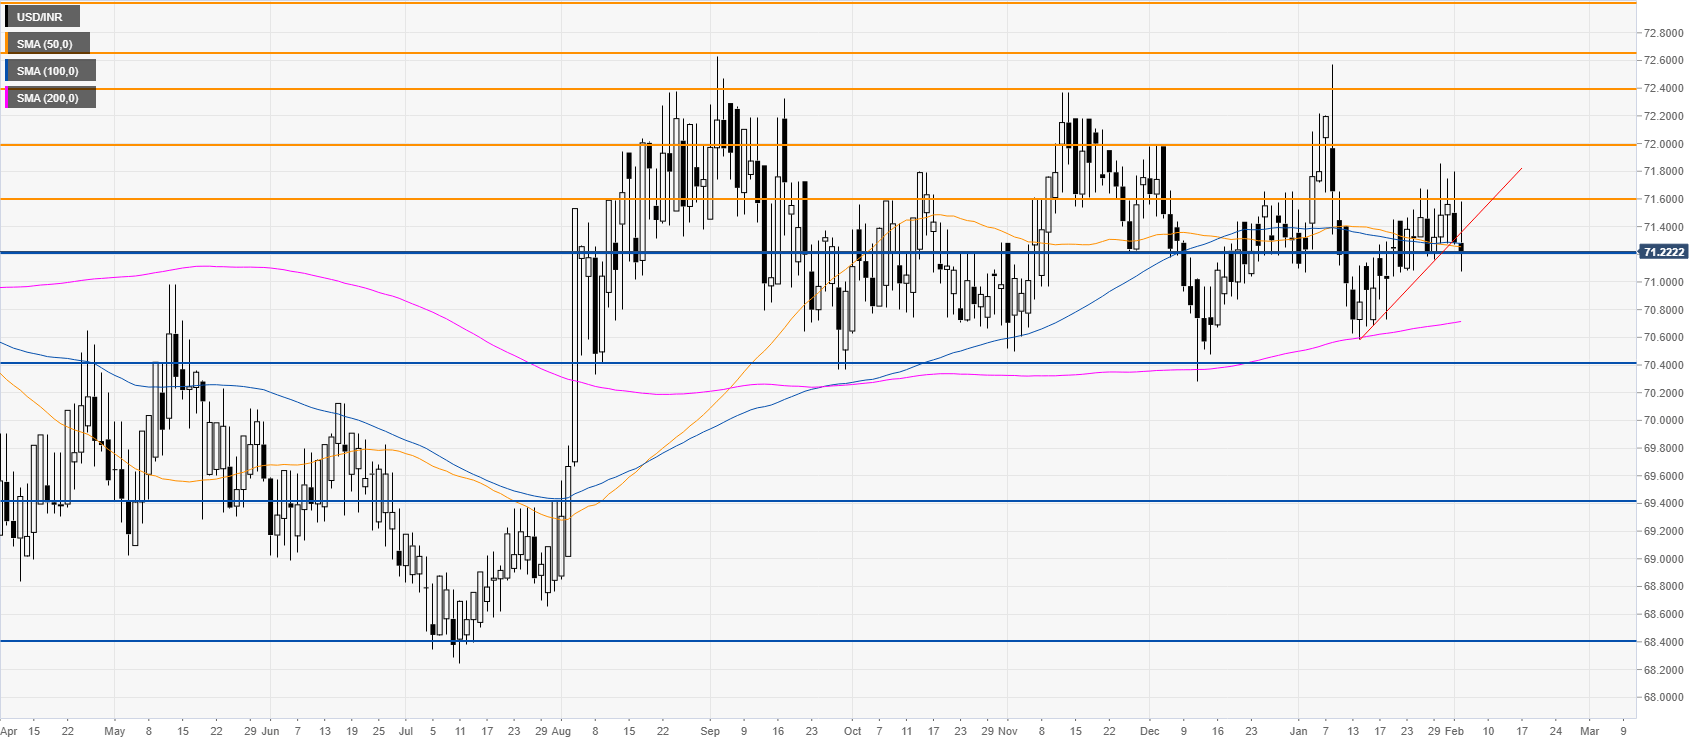
USD/INR daily chart
The spot formed a bear flag pattern within a rectangle. Bears want to break below the 71.20 support to drive the market towards the 70.40 level. On the flip side, a break above the 72.00 figure could open the gates to 72.40 resistance.
Additional key levels