

EUR/JPY Price Analysis: Break of key support trendline, 100-day SMA signal further downside
- EUR/JPY refreshes the monthly low on the break of key supports.
- 50% Fibonacci retracement, November month low on the bears’ radar.
- Buyers will stay away unless prices cross October high.
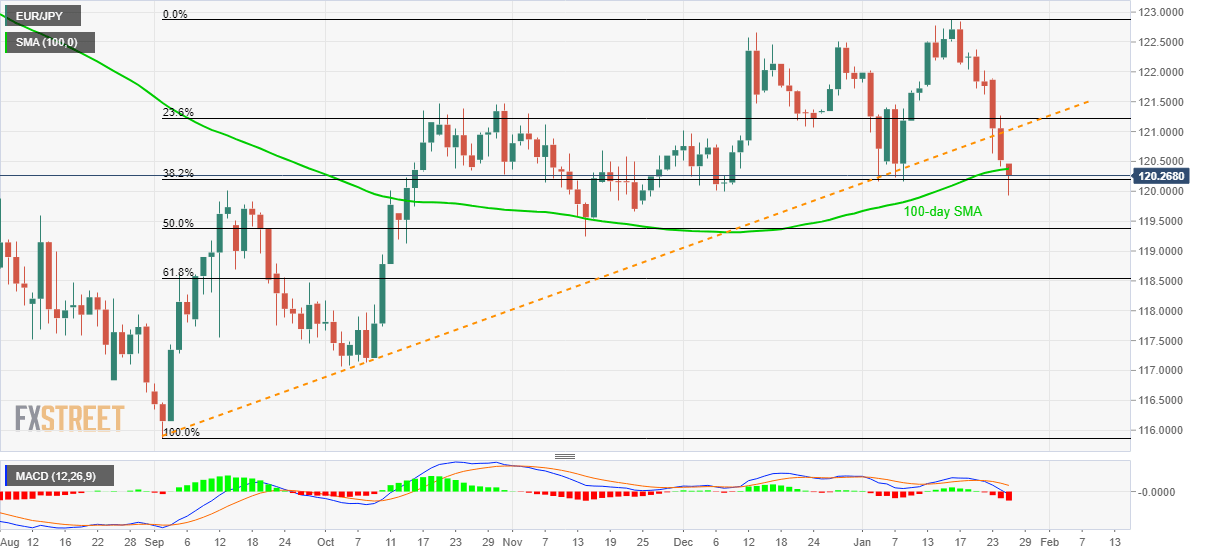
EUR/JPY trades near 120.30, following a fresh monthly low of 119.94 registered before few minutes, during the Asian session on Monday. The pair’s declines below an ascending trend line from early-September and 100-day SMA join bearish MACD to signal the pair’s further declines.
In doing so, 50% Fibonacci retracement of its upside from September 2019 to the current month high, around 119.35, coupled with November month low near 119.25, gain the sellers’ attention.
Should there be further weakness below 119.25, 61.8% Fibonacci retracement near 118.50 will become the bears’ favorite.
Meanwhile, pair’s daily closing above 100-day SMA level of 120.40 and the support-turned-resistance line of 121.00 will not be enough for the buyers’ recall as the October month high near 121.50 become the key resistance.
If the quote rallies beyond 121.50, its fresh run-up to 122.20 and 123.00 can’t be ruled out.
EUR/JPY daily chart
Trend: Bearish