确认您不是来自美国或菲律宾

在此声明,本人明确声明并确认:
  • 我不是美国公民或居民
  • 我不是菲律宾居民
  • 本人没有直接或间接拥有美国居民10%以上的股份/投票权/权益,和/或没有通过其他方式控制美国公民或居民。
  • 本人没有直接或间接的美国公民或居民10%以上的股份/投票权/权益的所有权,和/或受美国公民或居民其他任何方式行使的控制。
  • 根据FATCA 1504(a)对附属关系的定义,本人与美国公民或居民没有任何附属关系。
  • 我知道做出虚假声明所需付的责任。
就本声明而言,所有美国附属国家和地区均等同于美国的主要领土。本人承诺保护Octa Markets Incorporated及其董事和高级职员免受因违反本声明而产生或与之相关的任何索赔。
我们致力于保护您的隐私和您个人信息的安全。我们只收集电子邮件,以提供有关我们产品和服务的特别优惠和重要信息。通过提交您的电子邮件地址,您同意接收我们的此类信件。如果您想取消订阅或有任何问题或疑虑,请联系我们的客户支持。
Octa trading broker
开通交易账户
Back

AUD/NZD Price Analysis: Closer to multi-month-old support trendlines on New Zealand CPI

  • AUD/NZD drops to the fresh two-week low after New Zealand’s Q4 CPI beat estimates to the upside.
  • The upward sloping trend lines since August 2019 and the one connecting lows marked from March 2019 will restrict further declines.
  • 50-day SMA, 61.8% Fibonacci retracement will keep the near-term upside limited.

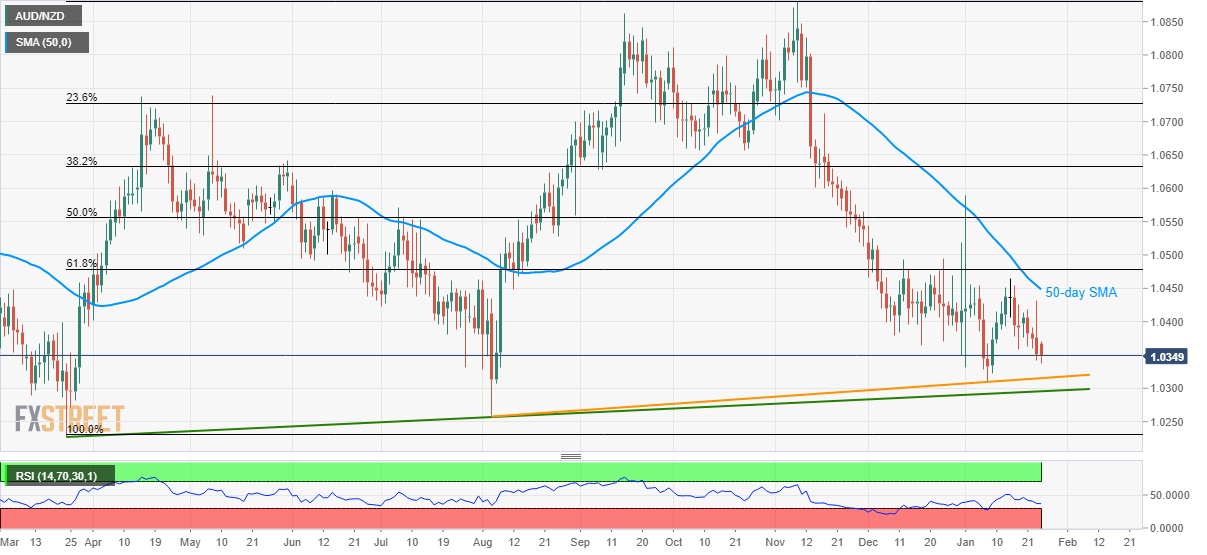
With the upbeat surprise from New Zealand’s fourth quarter (Q4) CPI pleasing New Zealand dollar buyers, AUD/NZD dropped to the fresh two-week low of 1.0337 after the data. The pair currently takes rounds to 1.0350 by the press time of early Asian morning on Friday.

As a result, the pair nears an ascending trend line stretched from August 2019, at 1.0315 now, as well as another support line connecting lows marked from March 2019, at 1.0295.

While the strength of the support lines is likely to restrict AUD/NZD declines below 1.0295, bears can target 1.0260 and 1.0220 during the declines post trend lines’ breaks.

On the upside, 1.0400 and 1.0430 can offer immediate resistance to the pair ahead of a 50-day SMA level near 1.0450.

However, pair’s upside beyond 1.0450 my find it difficult to cross 61.8% Fibonacci retracement of March-November 2019 upside, at 1.0480.

AUD/NZD daily chart

Trend: Bearish


Australia Commonwealth Bank Manufacturing PMI came in at 49.1, above forecasts (49) in January

Australia Commonwealth Bank Manufacturing PMI came in at 49.1, above forecasts (49) in January
了解更多 Previous

EUR/USD Price Analysis: Euro rolls into Asia below the 1.1063 resistance

EUR/USD is trading in a weak bear trend below its main simple moving averages (SMAs). Additionally, the spot is also breaking to the downside from a bull chann
了解更多 Next