WTI Technical Analysis: Steps back to $63.30 amid US-Iran de-escalation
- WTI stays positive around more than eight months’ top.
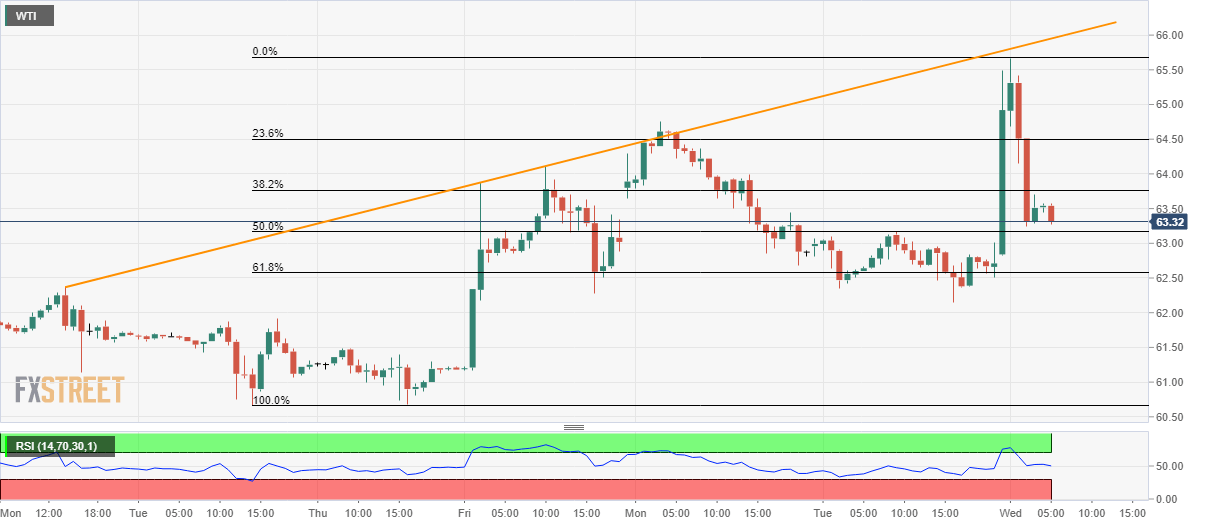
- Monthly trend line restricts near-term upside, sellers need to conquer 61.8% Fibonacci retracement.
WTI declines to $63.30, following the intra-day high of $65.67, by the press time of the pre-European session on Wednesday.
Read: Forex Today: Restrained US response to Iran’s attacks calms market, what next?
In doing so the black gold steps further backward from an ascending trend line since December 30. As a result, sellers will look for additional weakness towards 61.8% Fibonacci retracement of the current month upside at $62.58.
However, the energy benchmark’s fall below the key Fibonacci level might not hesitate to recall the 2019-end lows, around $60.65 and $60.00 round-figure.
On the flip side, 23.6% Fibonacci retracement level of $64.50 and the recent high of $65.67 can offer immediate resistance to the quote.
Though, bulls will not target 2019 top surrounding $66.57 unless WTI prices rally beyond the aforementioned resistance line, at $65.95 now.
WTI hourly chart
Trend: Pullback expected