

USD/IDR technical analysis: 38.2% Fibo, 14,195/205 confluence region question latest pullback
- USD/IDR bounces off the five-week low.
- 23.6% Fibonacci retracement and a four-month-old rising trend-line act as immediate supports.
The USD/IDR pair’s U-turn from five-week low still fails to overcome near-term key resistances as the quote trades near 14,045 during early Wednesday.
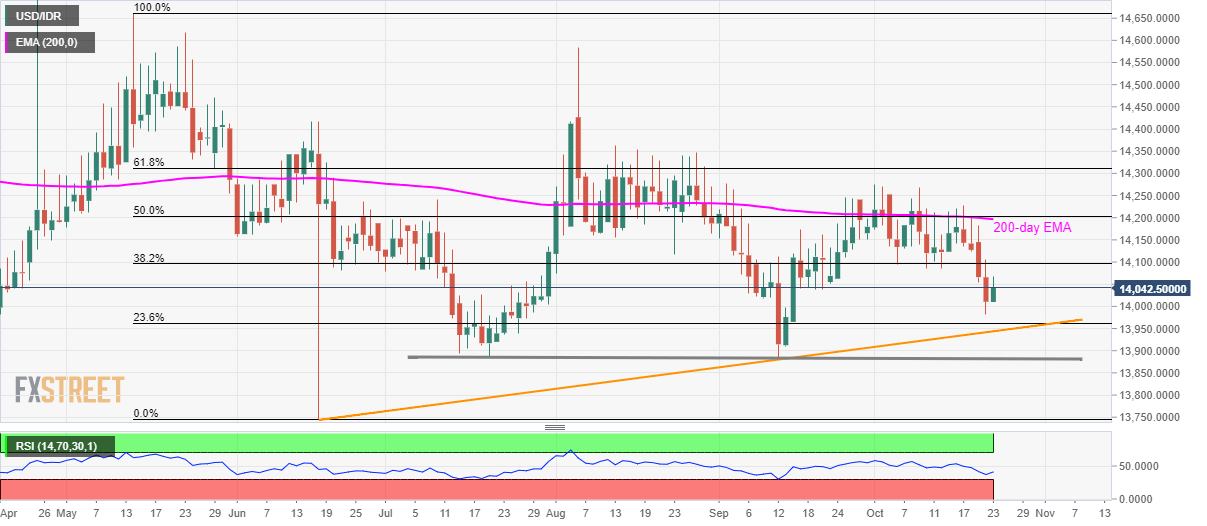
Among the upside barriers, 38.2% Fibonacci retracement of May-July declines, at 14,095 appears as the nearest resistance, a break of which could escalate the pair’s recovery towards 14,195/205 confluence region including 50% Fibonacci retracement and 200-day Exponential Moving Average (EMA).
Should prices manage to rise past-14,205 on a daily closing basis, current month high nearing 14,275 and 61.8% Fibonacci retracement at 14,311 will become buyers’ favorite.
On the downside, 23.6% Fibonacci retracement level of 13,962 and an upward sloping trend line since late-June, at 13,943 could restrict the pair’s immediate declines.
Assuming bears refrain from respecting 13,943 supports, a horizontal area including July and September month low, near 13,880 will be the key to watch.
USD/IDR daily chart
Trend: sideways