AUD/USD is erasing the Reserve Bank of Australia (RBA) inspired losses.
The level to beat for bulls is the 0.6874 resistance.
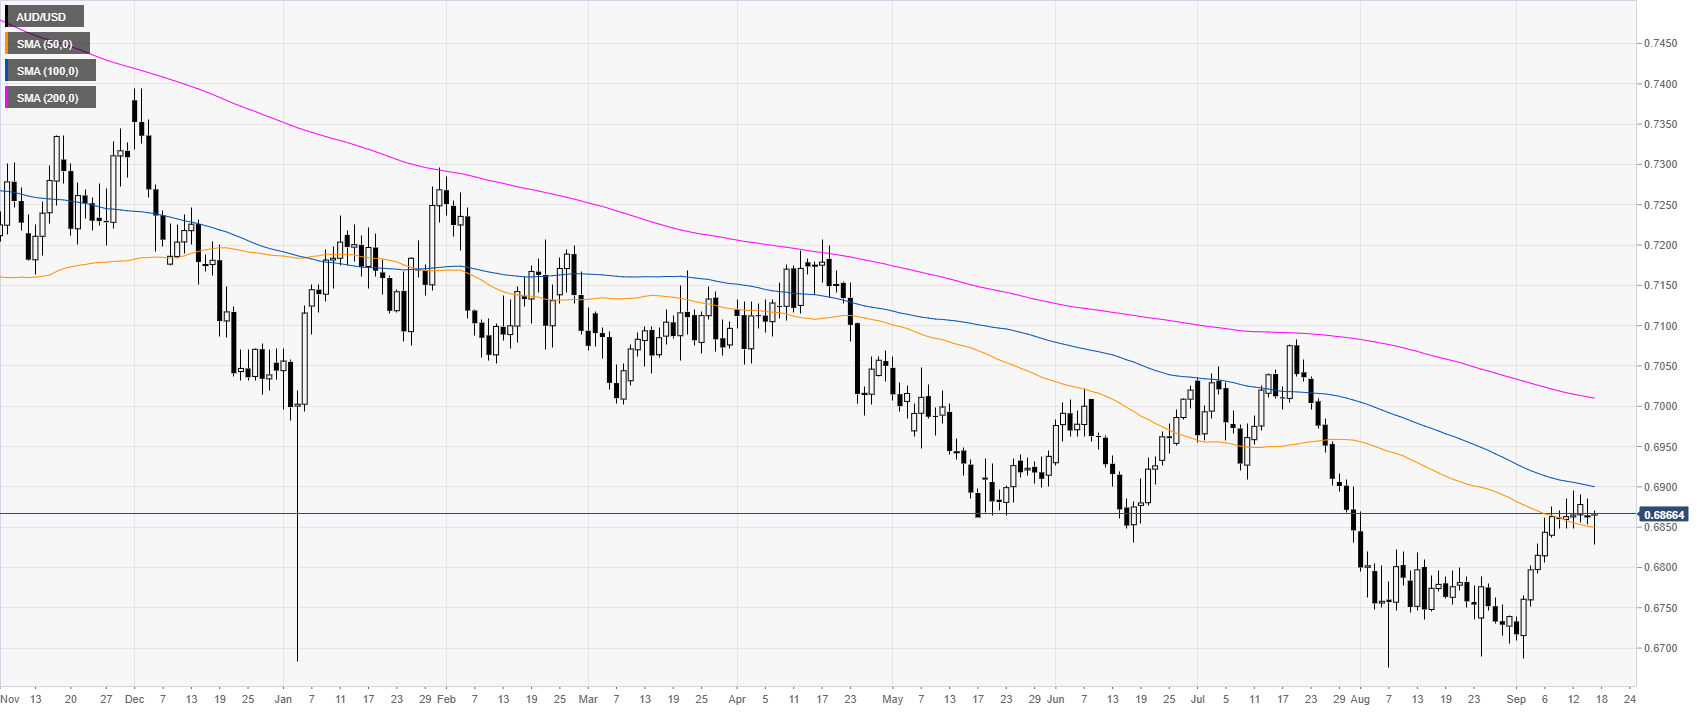
AUD/USD daily chart
The Aussie is trading in a bear trend below its 100 and 200-day simple moving averages (SMAs). However, this month the market has been rebounding sharply.
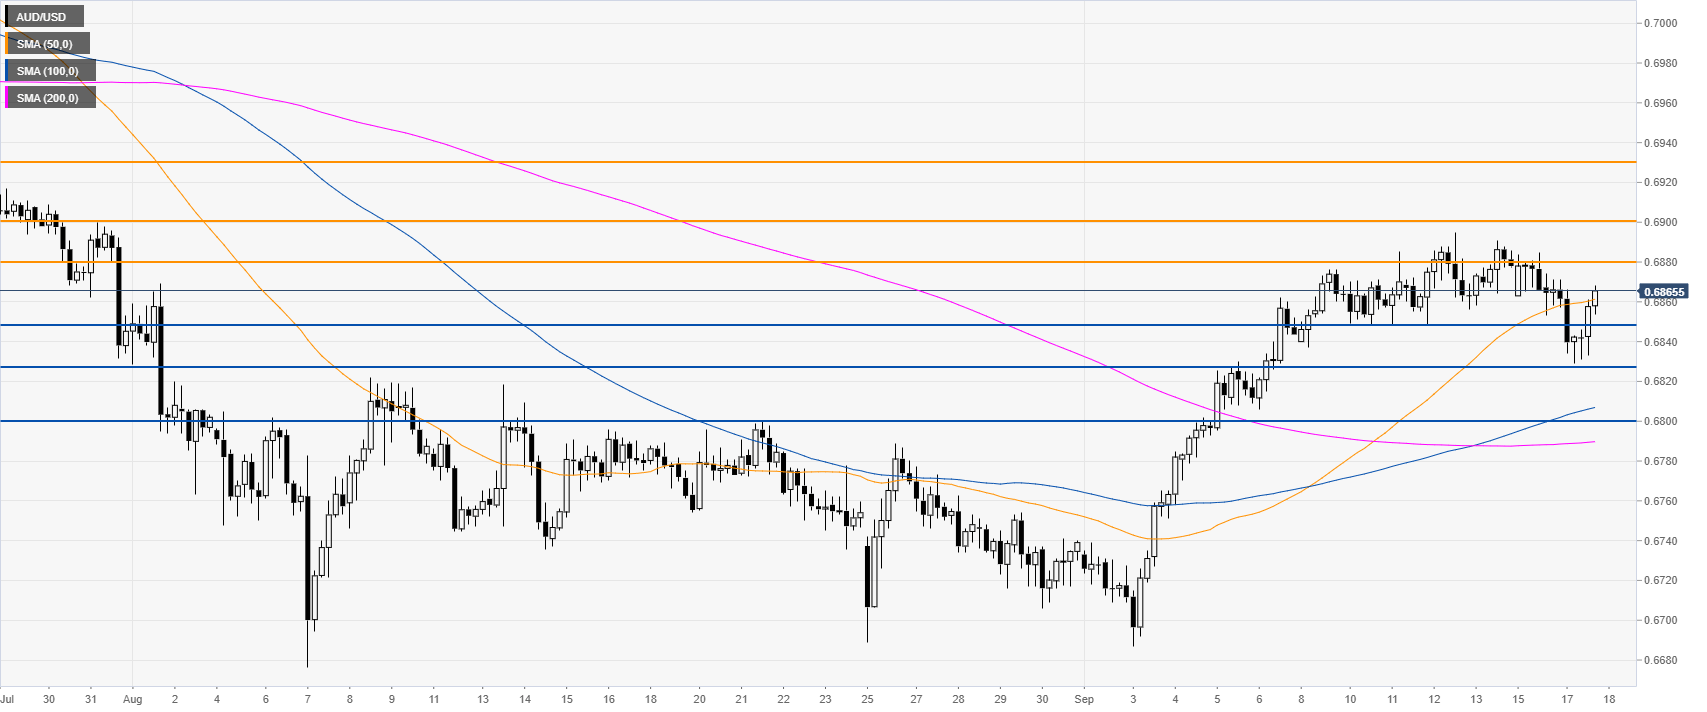
AUD/USD 4-hour chart
After a brief dip to the 0.6827 support, the Aussie is rebounding and trading above its main simple moving averages (SMAs), suggesting bullish momentum in the near term. The Aussie will need a daily close above the 0.6874 resistance to open the doors towards the 0.6900 and 0.6930 resistance, according to the Technical Confluences Indicator.
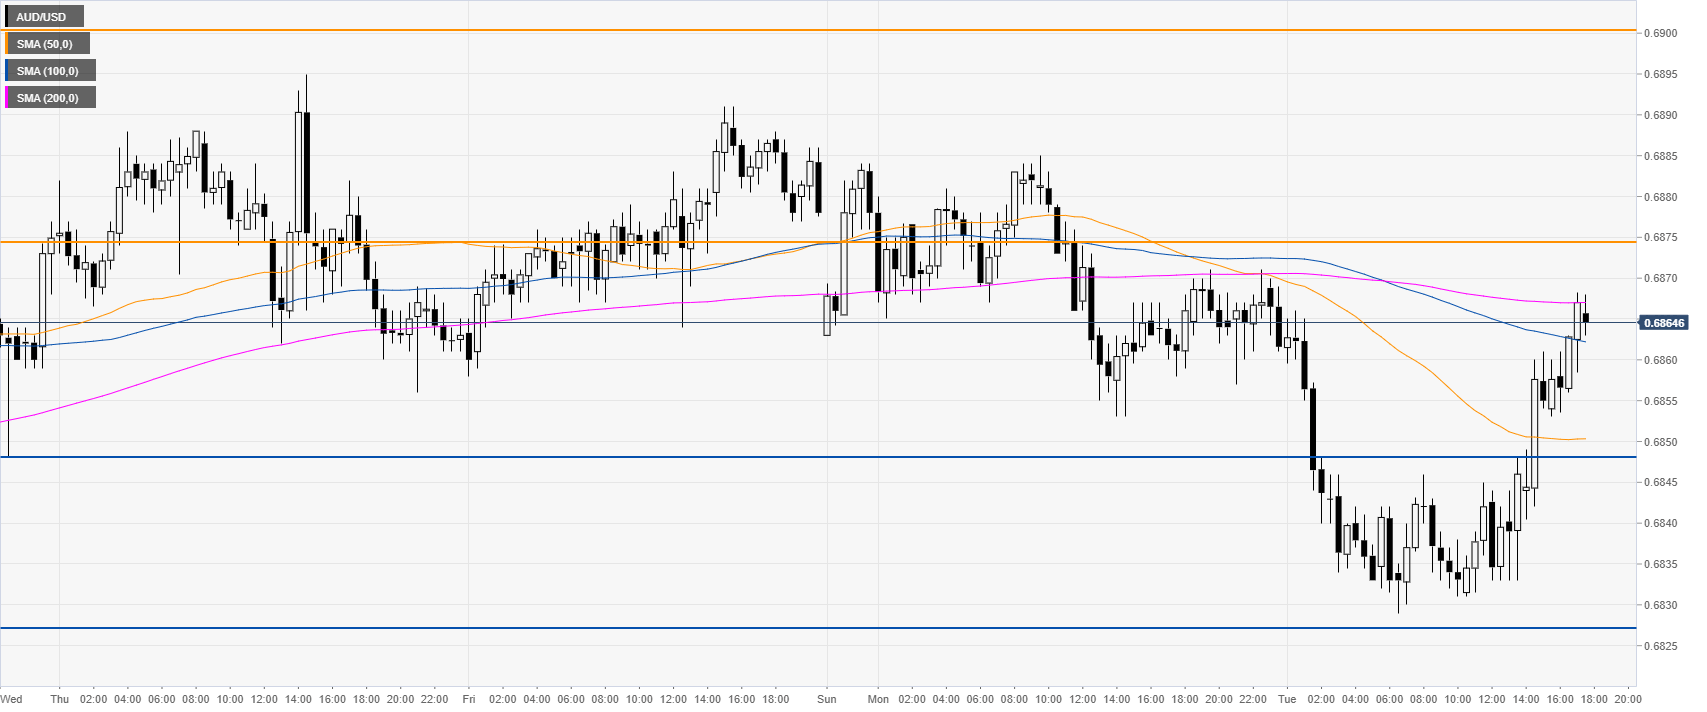
AUD/USD 30-minute chart
AUD/USD is trading near daily highs below the 0.6874 resistance and the 200 SMA. Immediate support is seen at the 0.6848 price level, according to the Technical Confluences Indicator.

 关于平台
关于平台