
提供最佳价差和条件
 关于平台
关于平台

The USD/JPY is trading at around 106.93 virtually unchanged on Monday as the main theme in the market are tensions revolving around the ongoing trade war between the US and China. In retaliation to a fresh US $100 billion worth of tariffs, China announced that they are considering devaluing their currency (yuan) in order to gain a commercial advantage.
The Japanese yen is under modest pressure as stocks on Wall Street are unaffected by the yuan´s devaluation threat and are in positive territories. The Japanese yen is bought as a safe-haven in market pullbacks and crashes.
The US Dollar is trading lower against the euro, the British pound, the Candian dollar, the NZD and the AUD. The USD/JPY pair has been containing the US Dollar weakness quite well although the technical picture is slightly deteriorating for bulls.
USD/JPY weekly chart
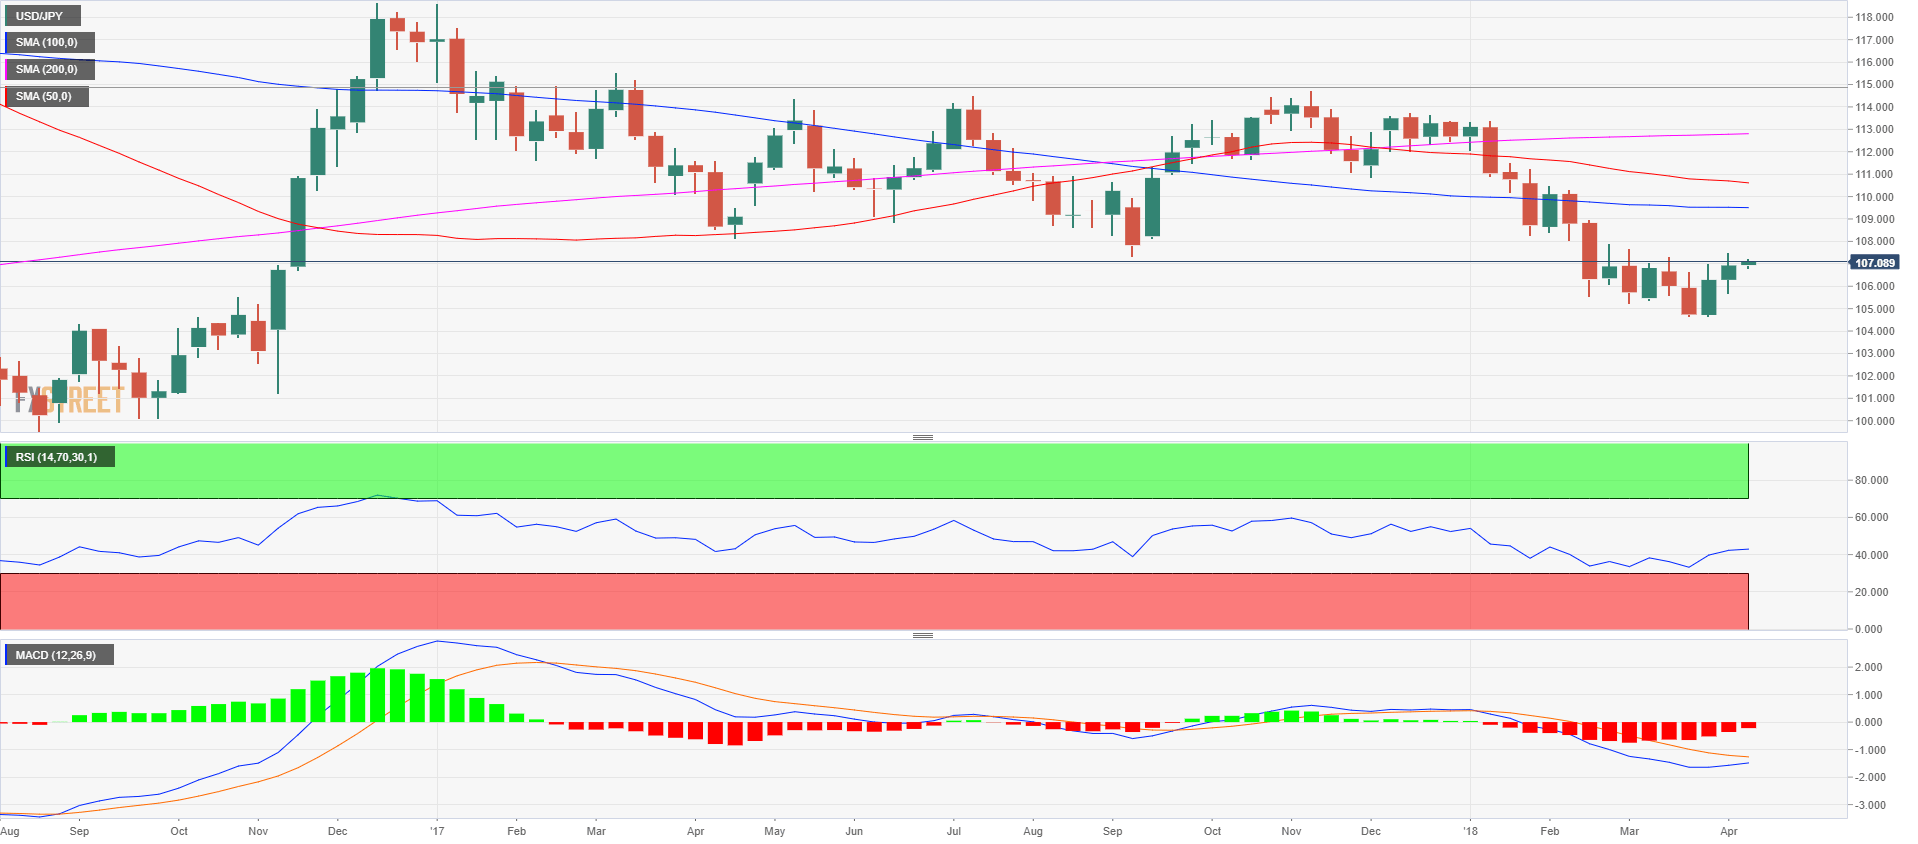
The bulls are trying to break above 107.51 (last week’s high) in order to reach the 108 psychological level. The daily RSI is at 42.95 and the MACD bear momentum is slowing down. The USD/JPY is trying to reverse its downtrend after the bulls took the lead on March 30, establishing a swing low.
USD/JPY daily chart
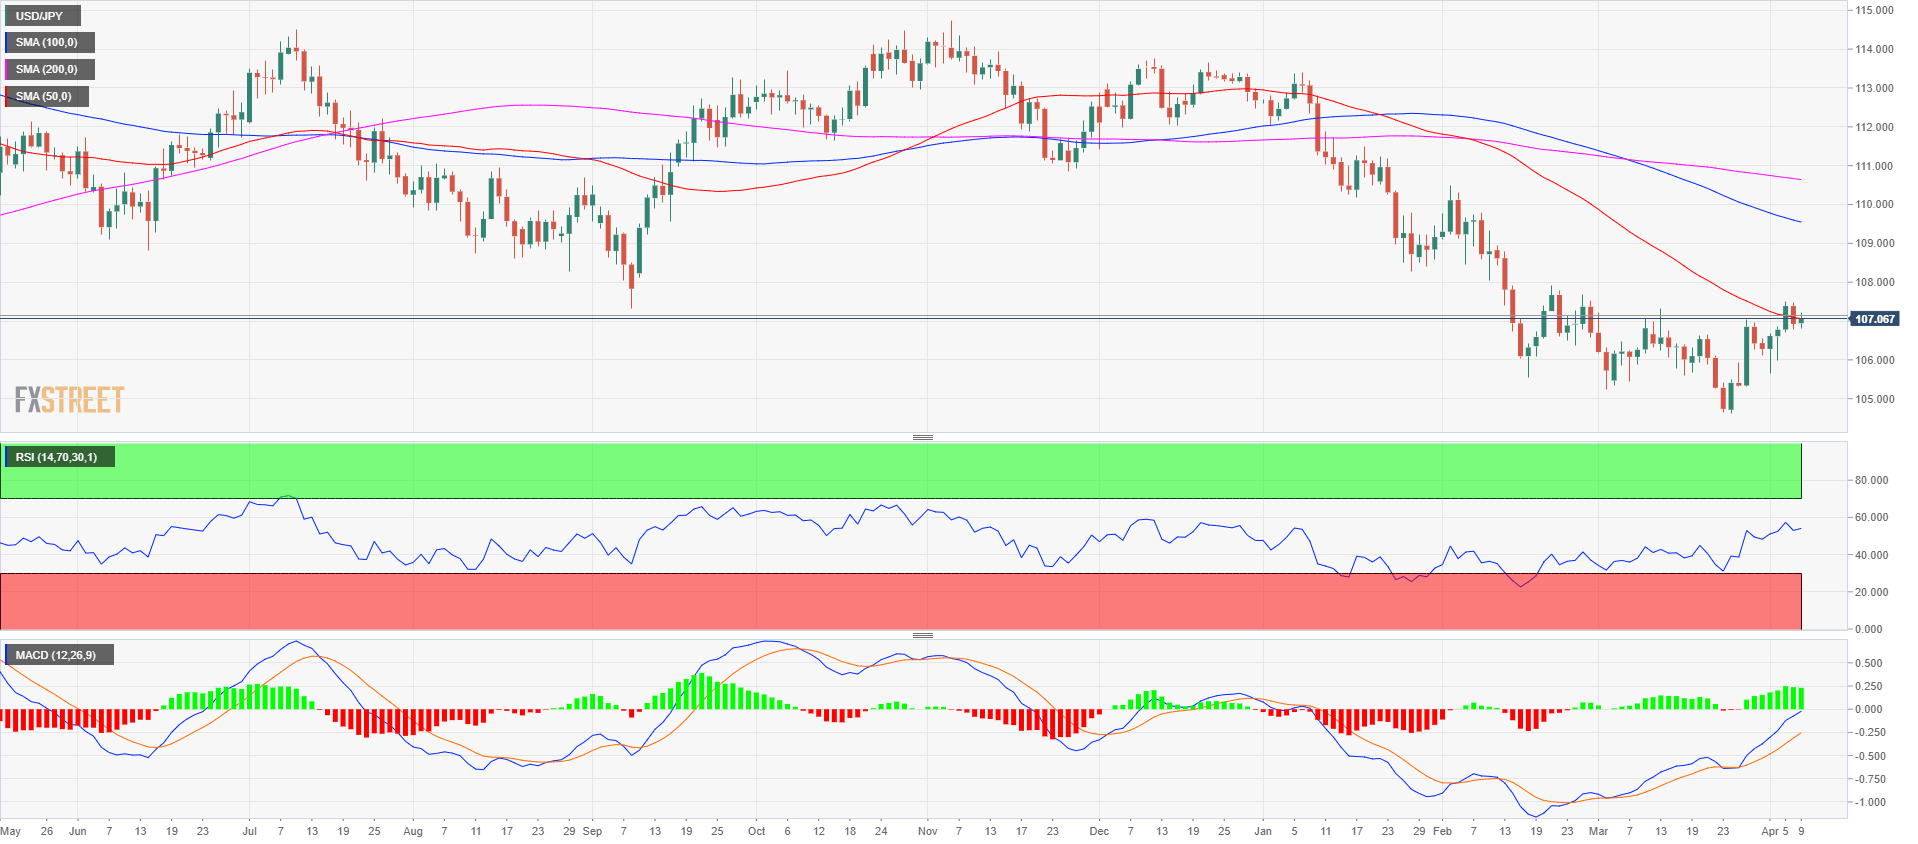
The market is currently consolidating in the 106.70-107.51 range, inside the range of the last two days. The 50-period simple moving average is capping the price as on Friday the market couldn’t close above it. The MACD bull momentum is slightly slowing down.
USD/JPY 4-hour chart
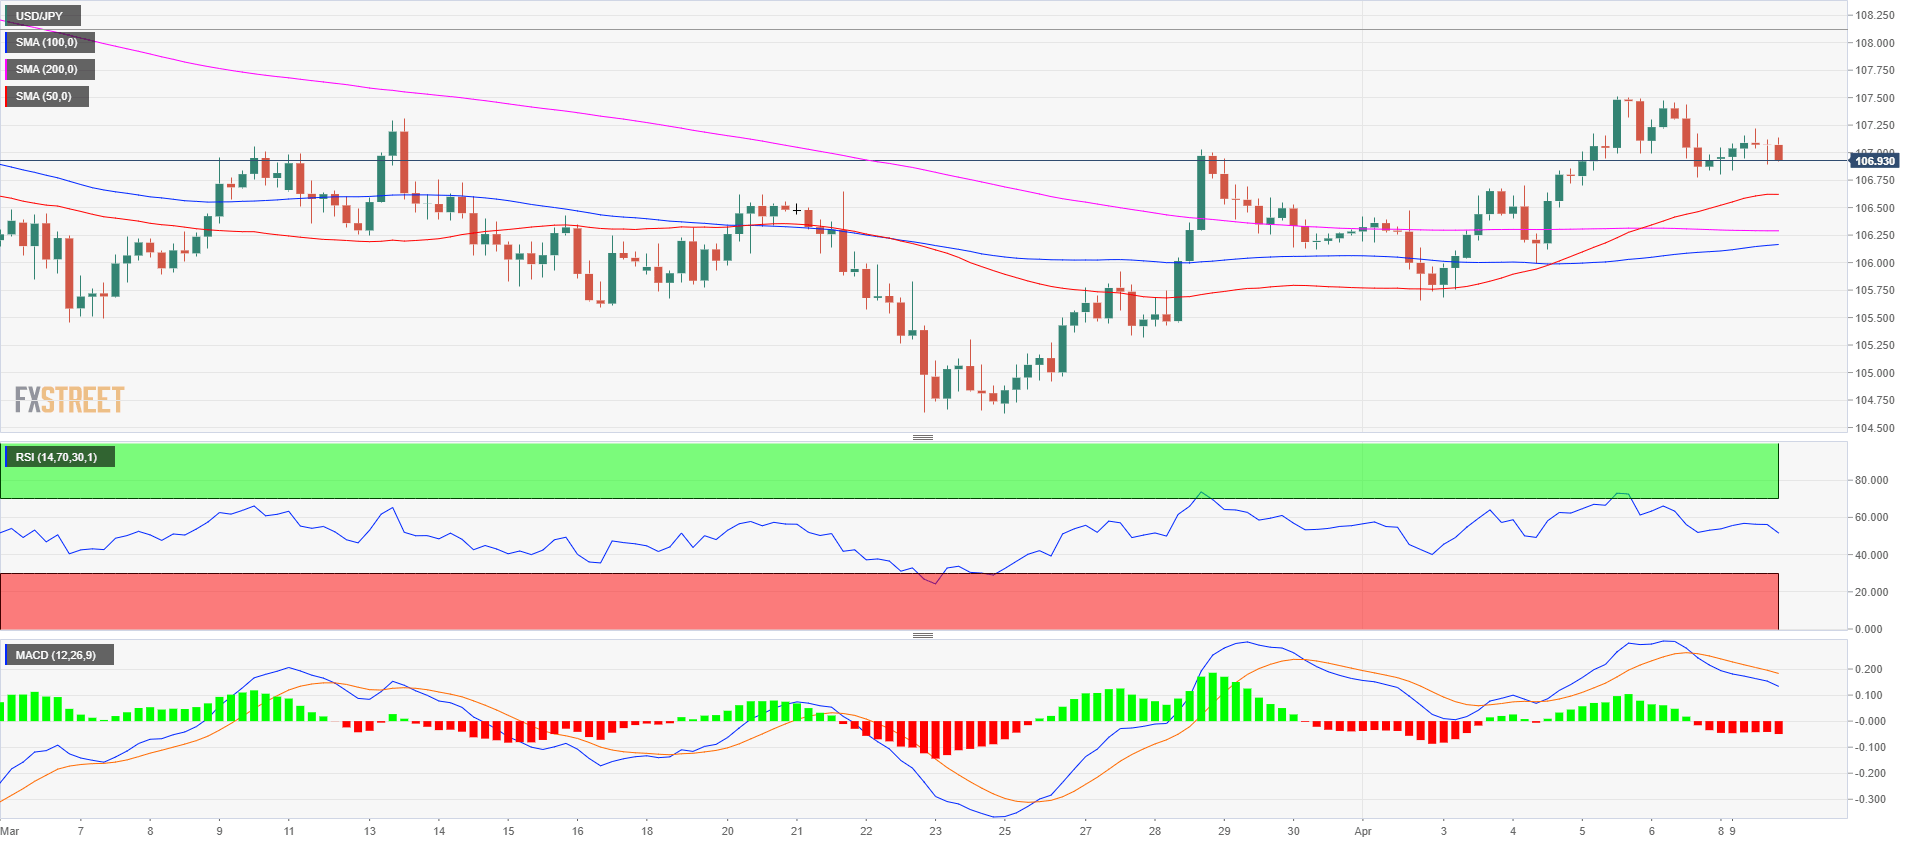
Supports are seen at 105.99 and 105.66 swing lows. Immediate resistance is at 107.22, followed by 107.50 (last week’s high). The RSI and MACD indicators are showing signs of weakness.


