

Gold bulls flirt with $1350 amid trade wars escalation
- Gold bulls are alive since the Fed dovish hike.
- $1400 is seen at the line in the sand.
Gold is trading at around 1346 up 1.36% on the day so far as trade wars between the US and China intensify.
Gold weekly chart
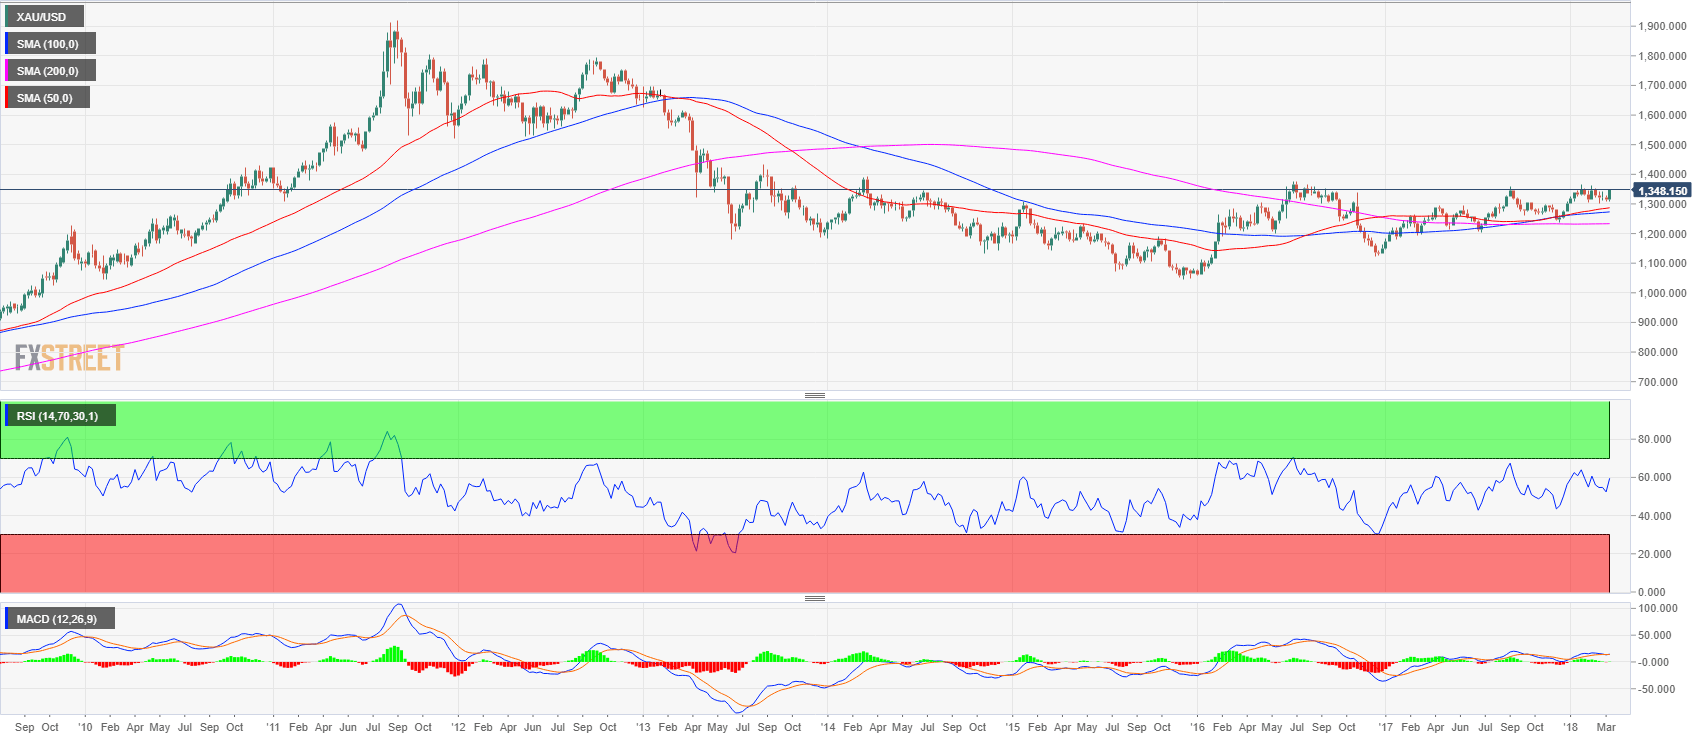
Gold is consolidating and grinding higher in an ascending triangle pattern. Resistance is seen at the high of the year close to the 1365 mark, followed by 1375 the 2016’s high which is only $25 away from the 1400 psychological level. According to many analysts, the 1400 level is the line in the sand that would confirm the bull trend in the yellow metal. Price action is above the 50, 100 and 200-period simple moving average and both the RSI and MACD indicators are trading in positive territories.
Gold daily chart
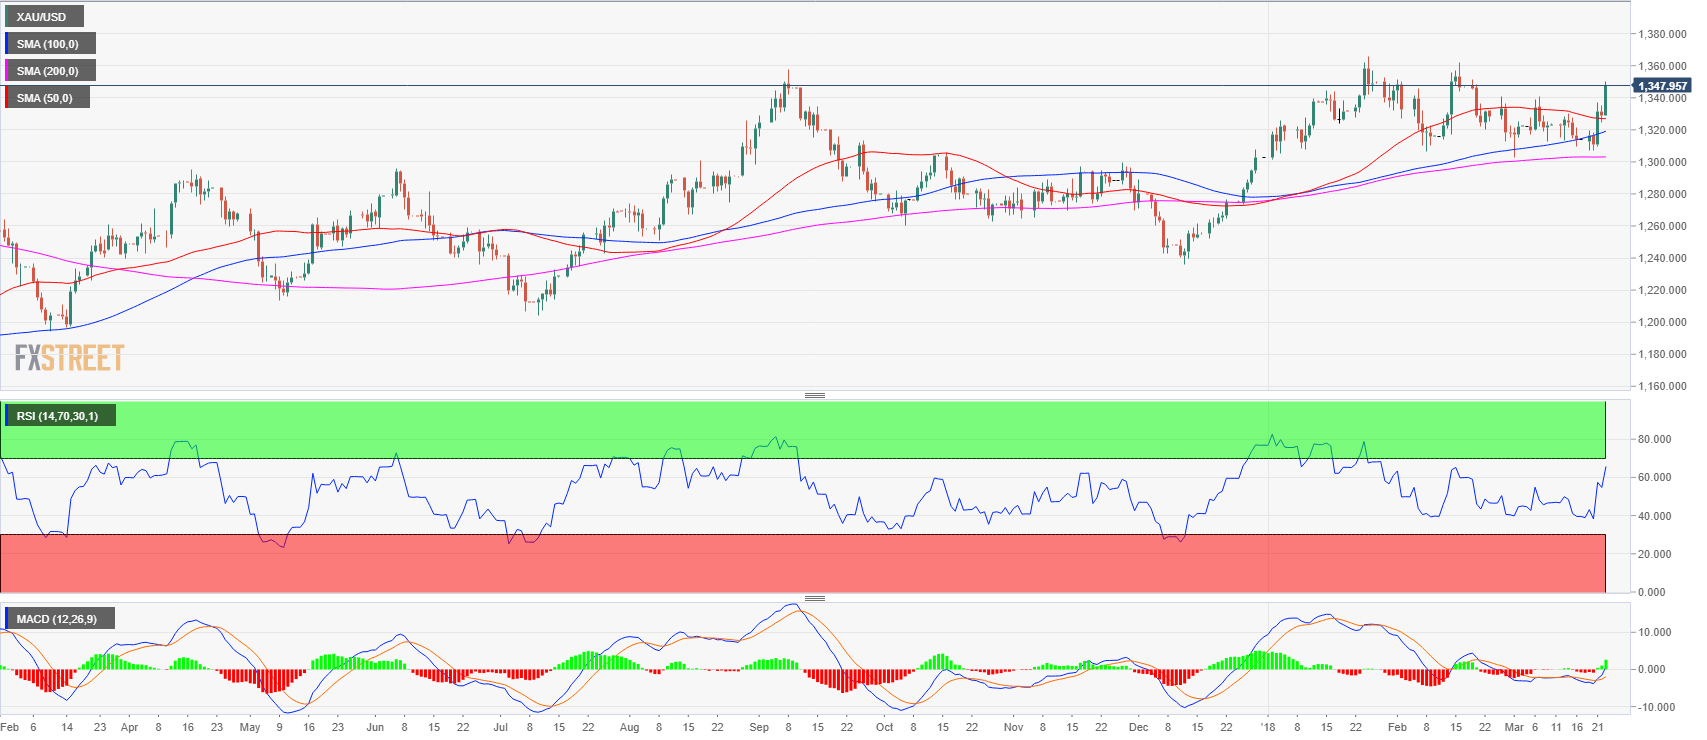
Gold, this Friday tested the 1350 level. After breaking from the bull flag formation on Wednesday on the Fed dovish hike where the US Dollar was sold across the board. Both the MACD and RSI indicators are constructive for bulls. The next key level is seen at approx 1360 high of the year while the 1400 level is the ever-important psychological level discussed in the weekly chart analysis. Support is seen at 1330 previous resistance discussed on Thursday; followed by the low of the range at 1306 which supported the price throughout the first months of 2018.
Gold 4-hour chart
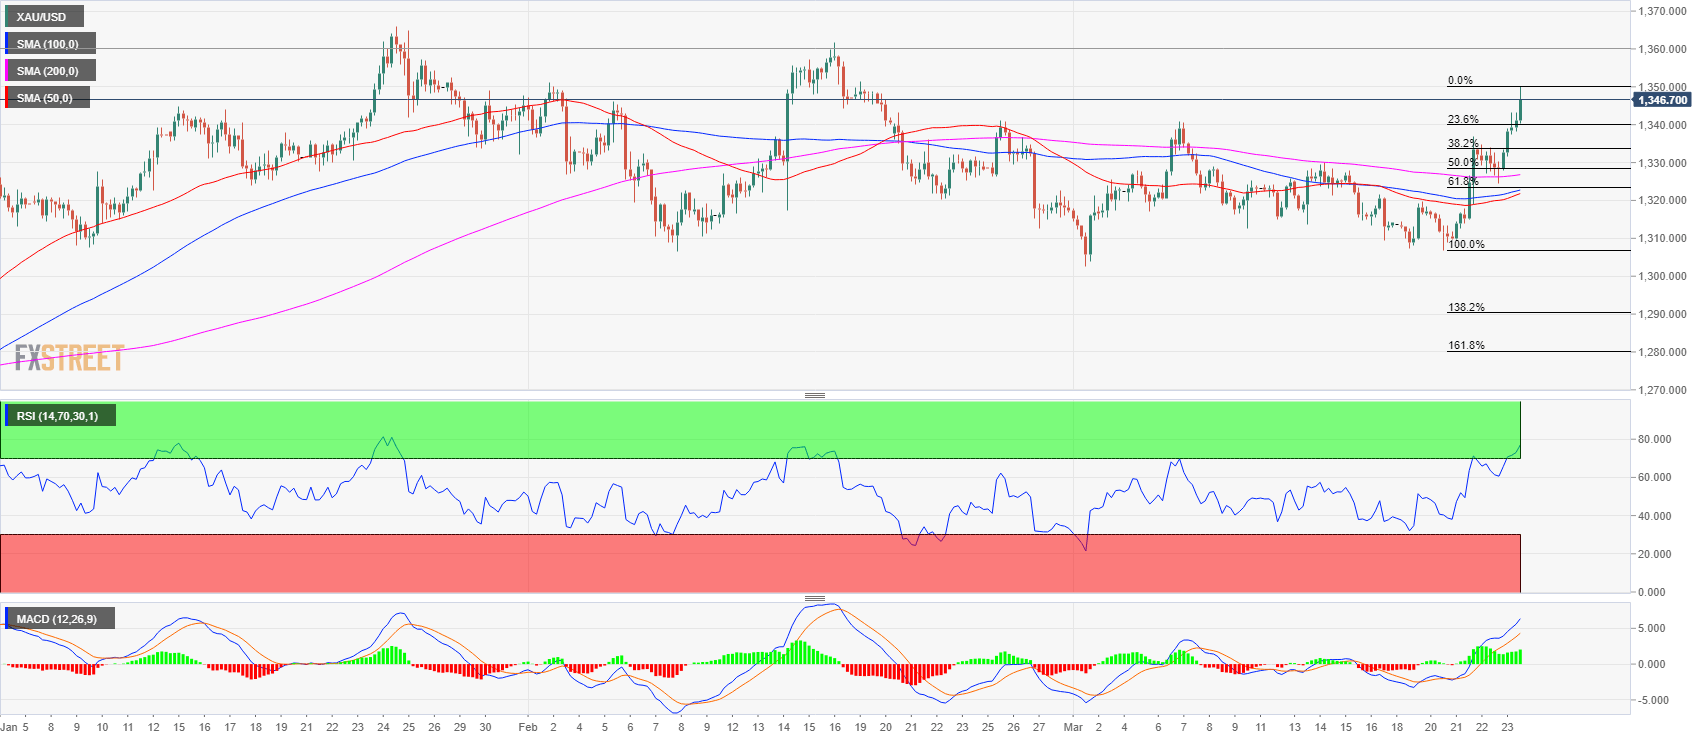
Gold made a two legged-moved ABCD pattern from the lows of the range at 1306 to the 1350 figure. The technical picture suggests that this might be a logical location for a pullback to occur. The RSI and MACD indicator are seen as bullish and no trend reversal seems to be on the cards as bulls have been relentless since Wednesday. Support is initially seen at 1340 which is the 23.6% Fibonacci retracement from the Wednesday-Friday bull leg; followed by 1330 former resistance level which now becomes support. With the army of moving averages just below the level as seen on the 240-minute chart. Resistance is seen in the 1360-1365 area with the high of the year.