
提供最佳价差和条件
 关于平台
关于平台

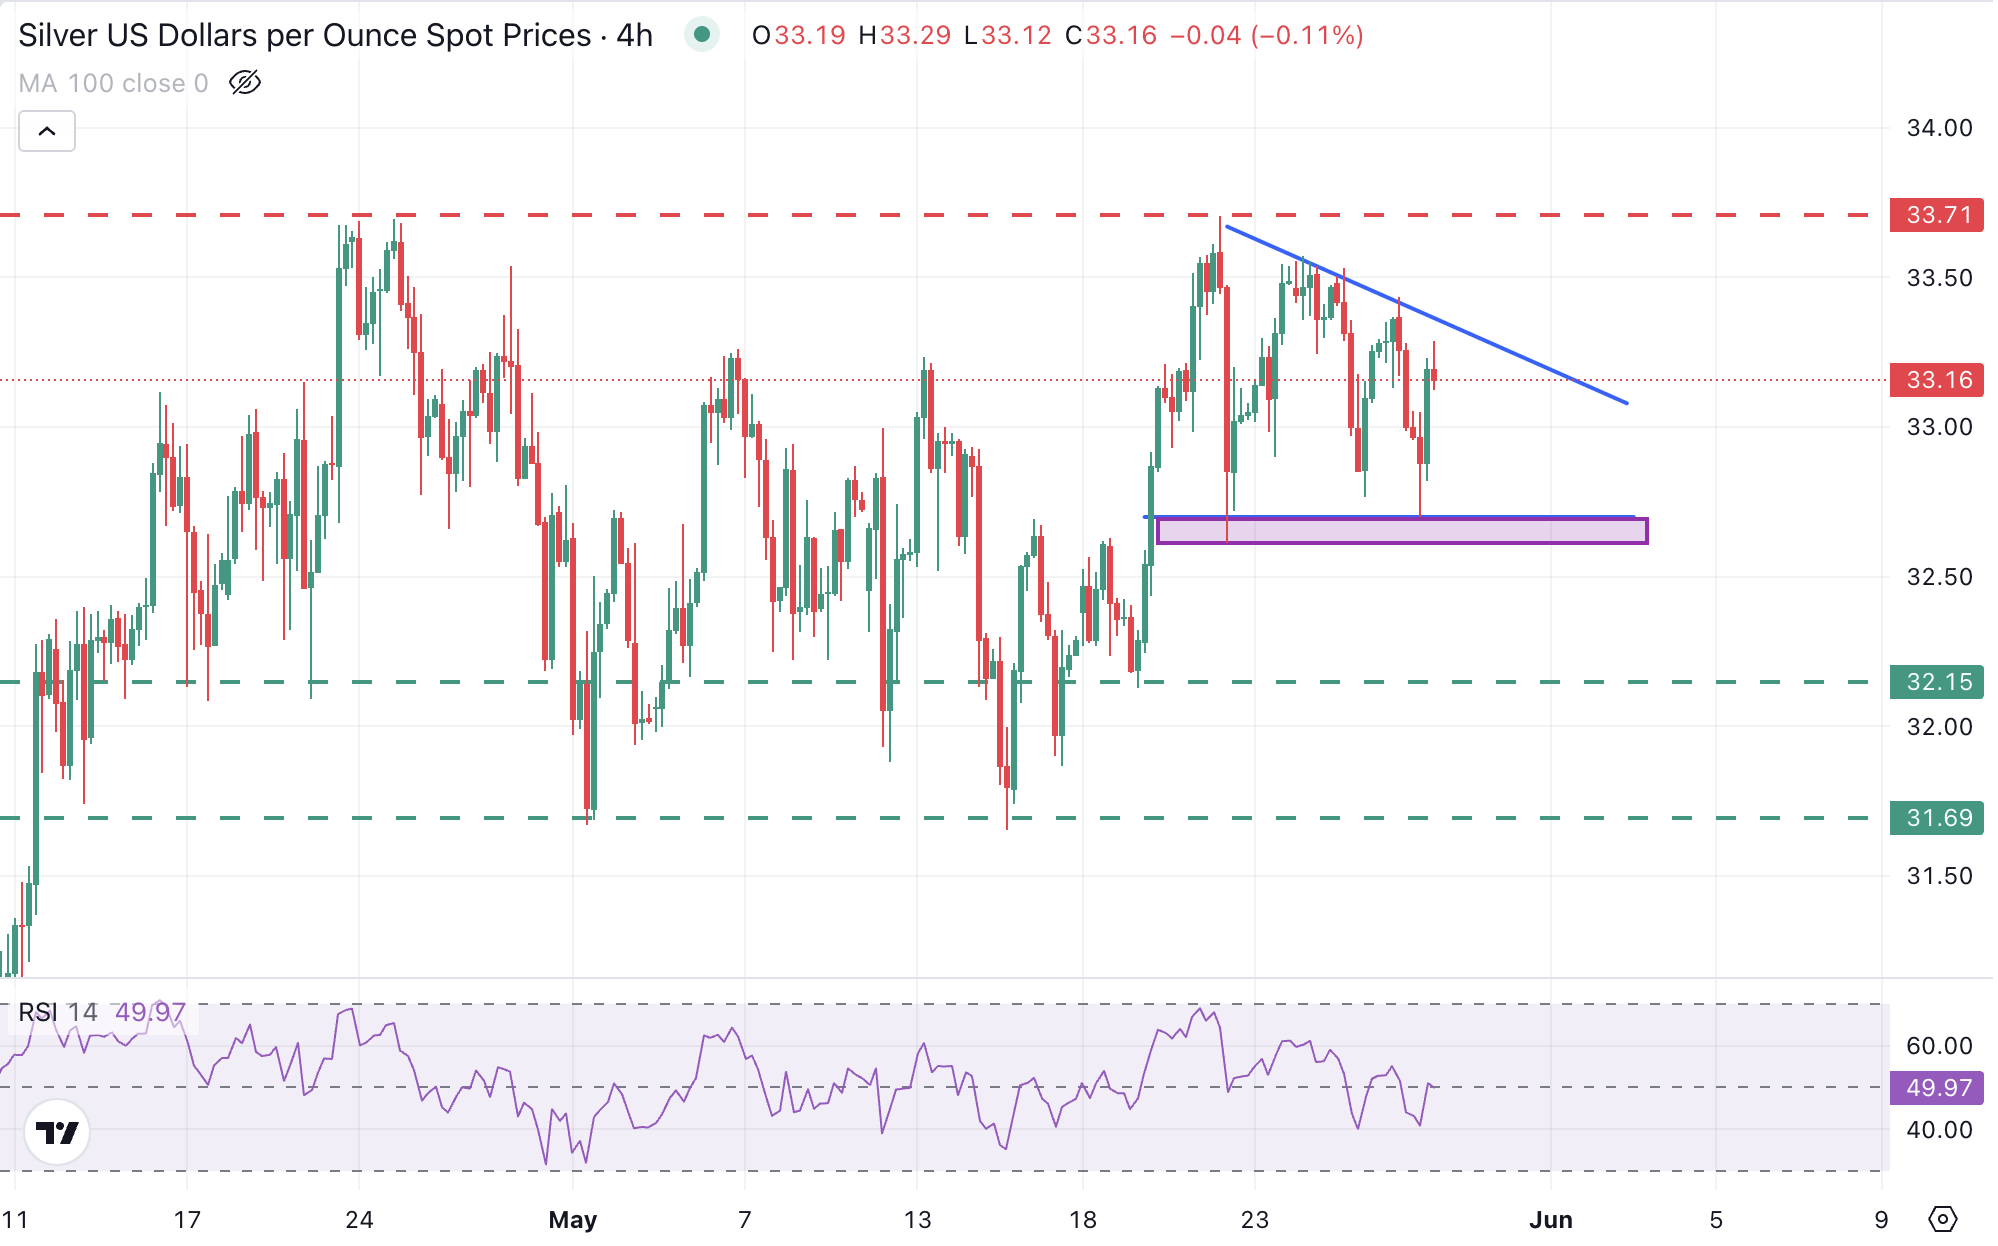
Silver prices (XAG/USD) are showing moderate gains on Thursday, after bouncing up from the support area, at $32.60-32.70 but the broader picture remains mixed with price action contained within recent ranges.
The fundamental background is unsupportive today. A US court has blocked Trump’s trade tariffs, and, although that might be positive for commodities trading, the US Dollar's strength might keep XAG/USD rallies limited.
Silver has been posting lower highs over the last trading days, after its rejection at $33.70. Price action is showing a descending triangle, which has a potential ¡bearish outcome.
Immediate support is at the mentioned $32.60-32.70 area, where the precious metals found buyers on May 22 and today. If this area is broken, the next support levels are the May 20 low at $32.15 and the May 1 and 15 lows, at the $31.70 area.
On the upside, a successful break of the triangle’s top, now around $33.35, cancels this view and brings the $33.70 top back into focus.
Silver is a precious metal highly traded among investors. It has been historically used as a store of value and a medium of exchange. Although less popular than Gold, traders may turn to Silver to diversify their investment portfolio, for its intrinsic value or as a potential hedge during high-inflation periods. Investors can buy physical Silver, in coins or in bars, or trade it through vehicles such as Exchange Traded Funds, which track its price on international markets.
Silver prices can move due to a wide range of factors. Geopolitical instability or fears of a deep recession can make Silver price escalate due to its safe-haven status, although to a lesser extent than Gold's. As a yieldless asset, Silver tends to rise with lower interest rates. Its moves also depend on how the US Dollar (USD) behaves as the asset is priced in dollars (XAG/USD). A strong Dollar tends to keep the price of Silver at bay, whereas a weaker Dollar is likely to propel prices up. Other factors such as investment demand, mining supply – Silver is much more abundant than Gold – and recycling rates can also affect prices.
Silver is widely used in industry, particularly in sectors such as electronics or solar energy, as it has one of the highest electric conductivity of all metals – more than Copper and Gold. A surge in demand can increase prices, while a decline tends to lower them. Dynamics in the US, Chinese and Indian economies can also contribute to price swings: for the US and particularly China, their big industrial sectors use Silver in various processes; in India, consumers’ demand for the precious metal for jewellery also plays a key role in setting prices.
Silver prices tend to follow Gold's moves. When Gold prices rise, Silver typically follows suit, as their status as safe-haven assets is similar. The Gold/Silver ratio, which shows the number of ounces of Silver needed to equal the value of one ounce of Gold, may help to determine the relative valuation between both metals. Some investors may consider a high ratio as an indicator that Silver is undervalued, or Gold is overvalued. On the contrary, a low ratio might suggest that Gold is undervalued relative to Silver.


