提供最佳价差和条件
 关于平台
关于平台

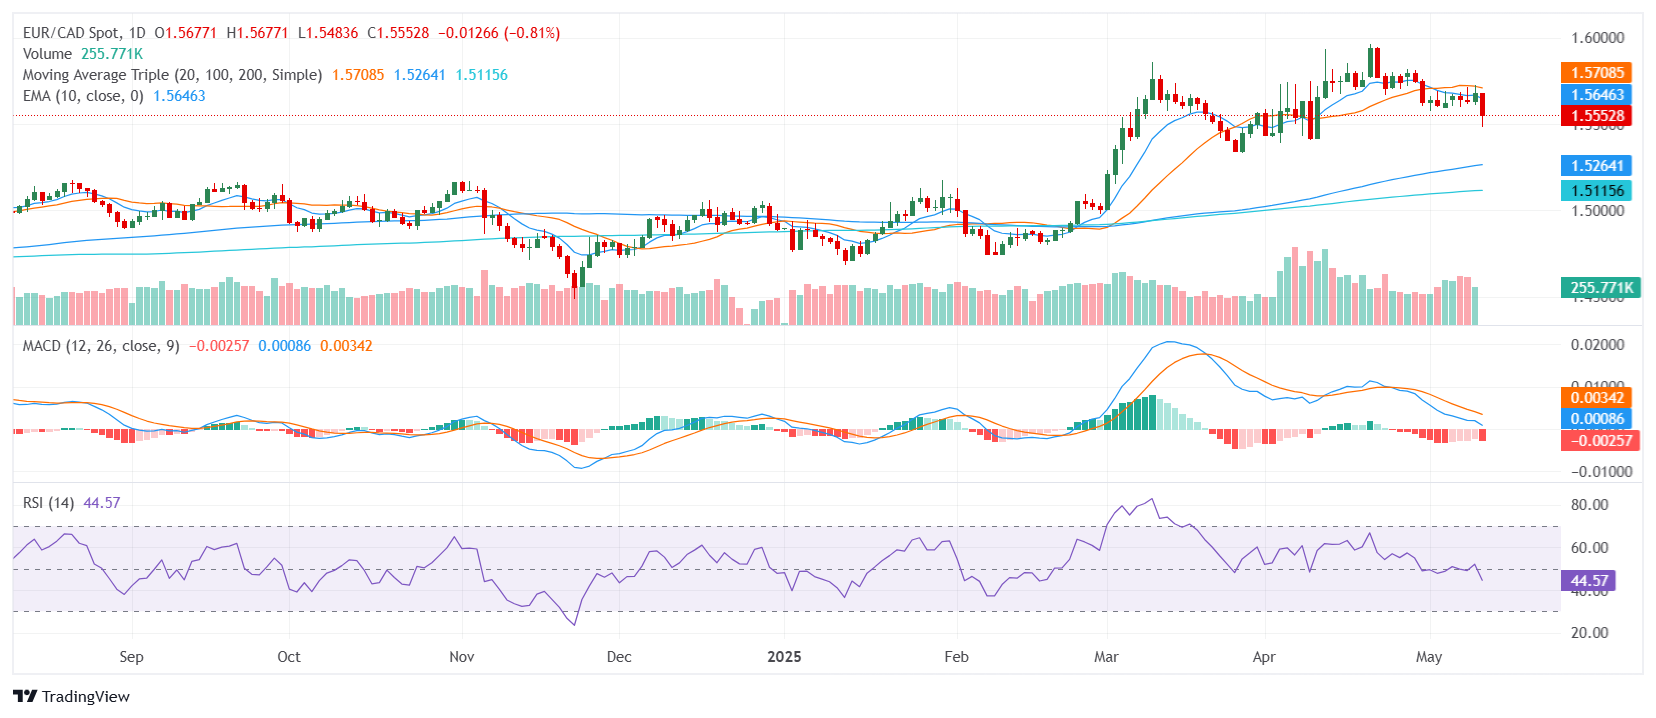
The EUR/CAD pair traded near the 1.5600 zone on Monday, reflecting a minor loss after the European session as selling pressure persisted. The pair remains within the middle of its daily range, suggesting cautious sentiment as traders assess the broader outlook. While short-term momentum remains tilted to the downside, longer-term trend indicators provide a more supportive backdrop, adding complexity to the current technical picture.
From a technical standpoint, the pair exhibits a generally bearish bias. The Relative Strength Index sits in the 40s, reflecting balanced momentum without immediate oversold conditions. The Moving Average Convergence Divergence confirms the bearish tone with a clear sell signal, aligning with the broader short-term trend. Meanwhile, the Ultimate Oscillator also holds in the 40s, reinforcing the neutral-to-bearish outlook, while the Bull Bear Power and Stochastic %K remain in neutral territory, indicating a lack of strong directional momentum.
Short-term trend indicators further support the downside bias. The 10-day Exponential Moving Average and 10-day Simple Moving Average both sit above the current price and slope downward, reinforcing immediate resistance. The 20-day Simple Moving Average also trends lower, adding to the selling pressure. In contrast, the 100-day and 200-day Simple Moving Averages remain well below current levels, suggesting that broader structural support persists despite the recent pullback.
Support levels are identified at 1.5549, 1.5369, and 1.5264. Resistance is found at 1.5617, 1.5627, and 1.5633. A sustained break below the immediate support zone could accelerate the decline, while a recovery above resistance would be needed to challenge the prevailing bearish outlook.