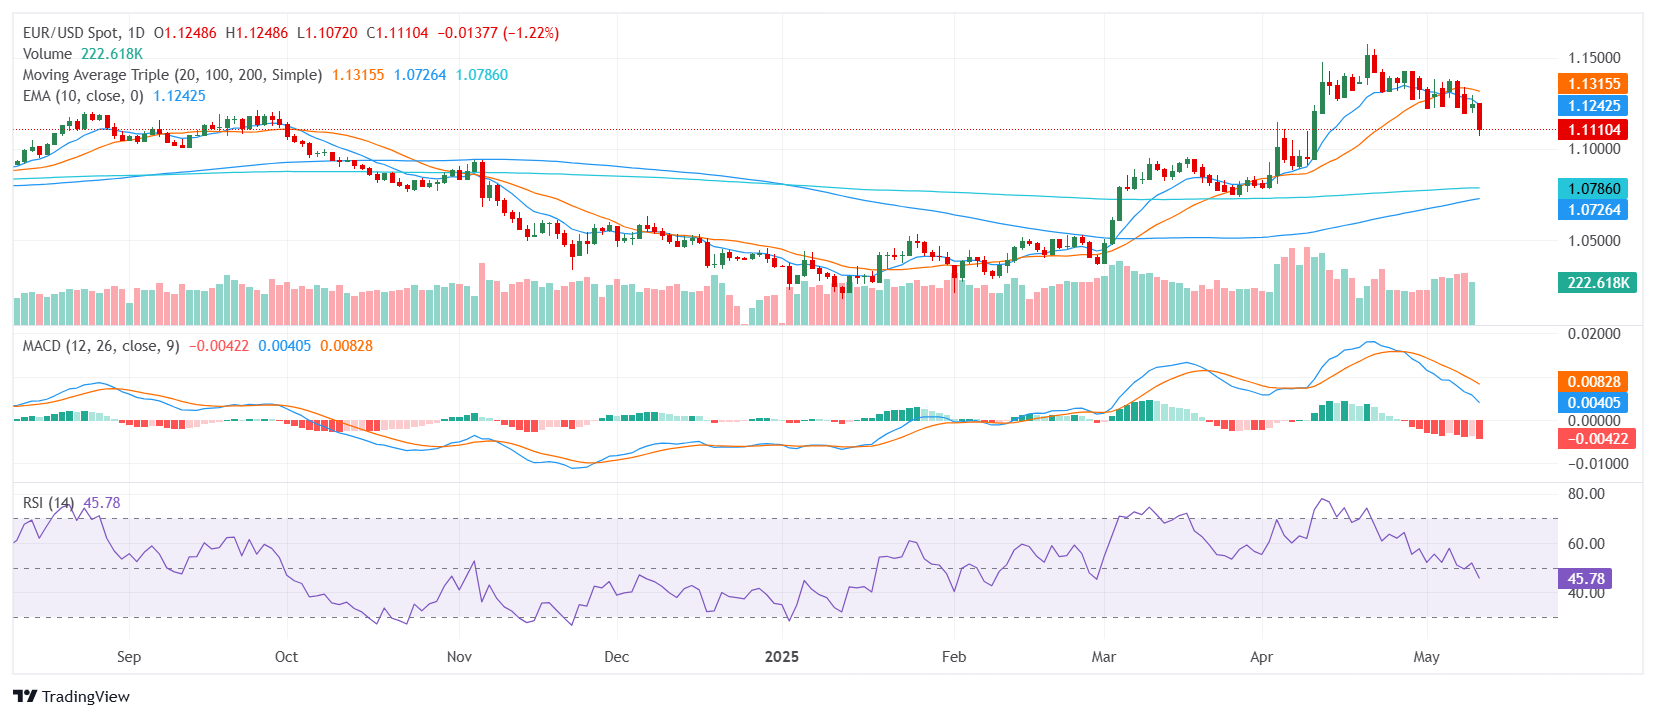
EUR/USD Price Analysis: Euro drifts near 1.1100 as bearish momentum builds
- EUR/USD trades around the 1.1100 zone after a sharp decline in Monday’s session.
- Short-term indicators confirm bearish sentiment despite conflicting long-term signals.
- Key support levels hold below, while resistance clusters just above the current range.
The EUR/USD pair traded near the 1.1100 zone on Monday, reflecting a sharp drop after the European session as sellers gained control. The pair remains within the middle of its daily range, suggesting that while bearish pressure is dominant, the market lacks a clear breakout signal. The technical landscape is mixed, with short-term signals aligning more closely with the downside, while longer-term indicators offer a more supportive backdrop.
From a technical standpoint, the pair is flashing a bearish overall signal. The Relative Strength Index sits in the 40s, reflecting neutral conditions without immediate oversold pressure. The Moving Average Convergence Divergence, however, prints a firm sell signal, confirming the recent downside momentum. The Awesome Oscillator hovers around zero, indicating neutral momentum, while the Ultimate Oscillator also remains in the 30s, reinforcing the cautious tone.
Short-term trend indicators lean heavily bearish. The 10-period Exponential and Simple Moving Averages both sit near the current price and slope downward, reinforcing immediate selling pressure. In contrast, the longer-term 100-day and 200-day Simple Moving Averages remain well below the current zone and continue to slope upward, suggesting that broader structural support remains in place despite the recent pullback.
Support levels are identified at 1.1082, 1.1073, and 1.0909. Resistance is found at 1.1192, 1.1202, and 1.1225. A sustained move below the immediate support zone could accelerate the decline, while a recovery above resistance would be needed to challenge the prevailing bearish outlook.
Daily Chart