EUR/GBP Price Analysis: Sterling slips as euro regains traction post-Europe
- EUR/GBP trades near the mid-0.8500s after gaining ground post-European session.
- Bullish bias intact despite mixed short-term signals.
- Key moving averages and longer-term indicators support upside momentum.
The EUR/GBP is trading with mild gains on Wednesday, hovering around the mid-0.8500 zone following the European session. The pair rebounded within the day’s range, showing modest upward pressure. Despite a neutral reading from the Relative Strength Index and a bearish signal from the Moving Average Convergence Divergence, other tools like the Williams Percent Range and longer-term Simple Moving Averages help preserve a bullish tone. Traders are navigating through a mixed set of indicators while the price consolidates near short-term support.
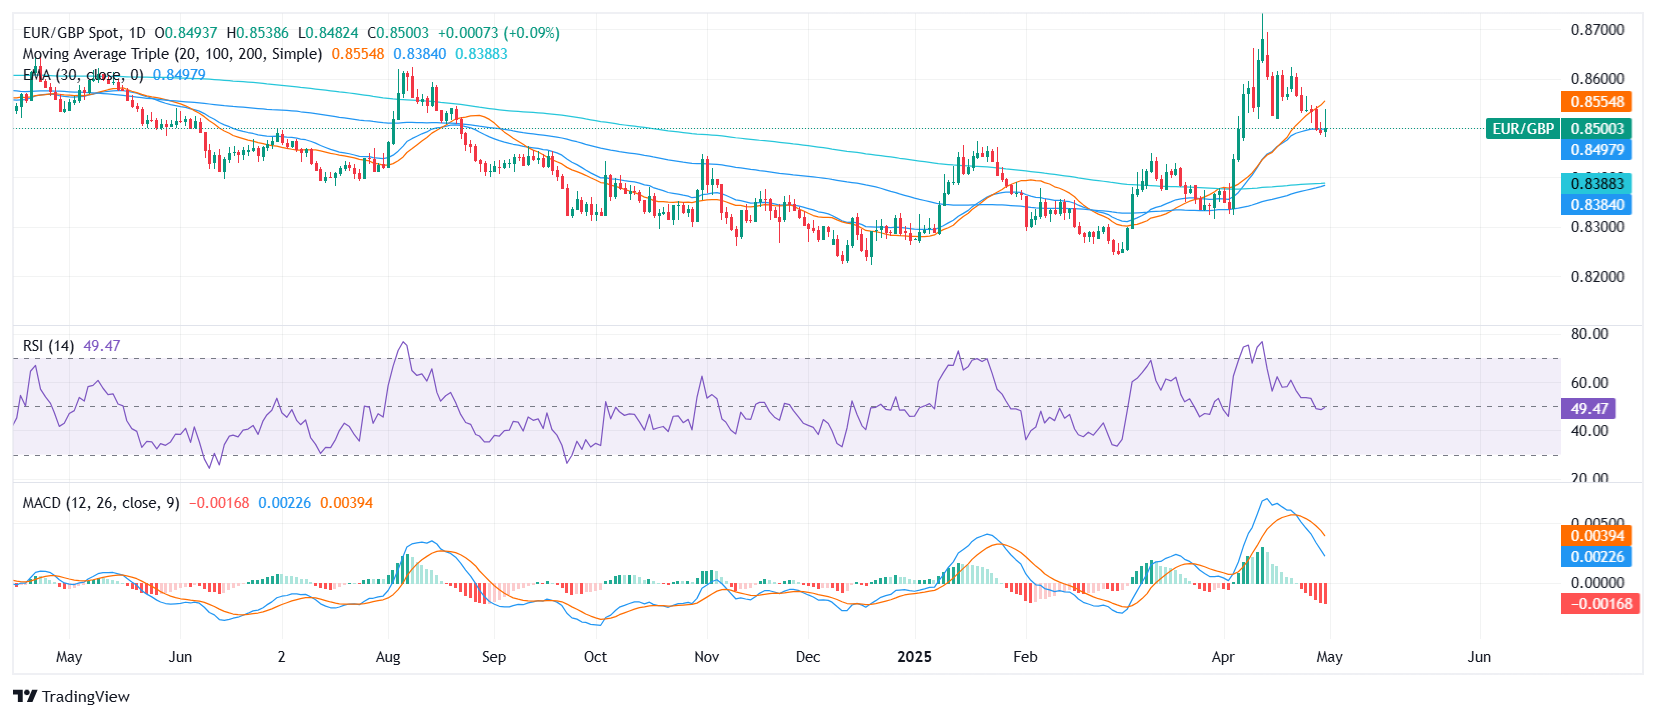
EUR/GBP is currently showing a bullish structure overall. The MACD flashes a sell signal, indicating some resistance to immediate upside continuation, while the RSI holds in neutral territory near 50, confirming the indecision. On the other hand, the Williams Percent Range (14) at roughly -92 supports a rebound narrative, suggesting the pair may have entered oversold territory intraday. The Commodity Channel Index also remains in neutral ground, adding to the mixed short-term sentiment.
From a moving average perspective, the short-term 30-day exponential and simple moving averages, both below current price action, are signaling bullish momentum. However, the 20-day SMA, positioned just above the pair, acts as dynamic resistance and could cap immediate upside. Notably, the 100-day and 200-day SMAs — both sitting clearly below current levels — strengthen the longer-term bullish case.
Support lies at 0.8494, followed by 0.8485 and 0.8482. Resistance levels are seen at 0.8516, 0.8525, and 0.8526.
Daily Chart