

NZD/USD Price Forecast: Posts fresh weekly high near 0.5700
- NZD/USD refreshes weekly high near 0.5700 as receding global trade war risks have improved the safe-haven demand.
- The USD strives to gain ground on the back of upbeat US ADP Employment data for January.
- The NZ economy will also face the consequences of the US-China trade war.
The NZD/USD pair posts a fresh weekly high near 0.5700 in Wednesday’s North American session. The Kiwi pair gains as the US Dollar (USD) has remained under pressure due to receding risks of a global trade war.
Investors expect the trade war to remain between the United States (US) and China as the latter has imposed tariffs on a few items from the US economy in retaliation to President Donald Trump’s decision of a 10% levy on all imports from China.
The US Dollar Index (DXY), which tracks the Greenback’s value against six major currencies, refreshes weekly low to near 107.40. However, the Greenback has got some buying interest after the release of the United States (US) ADP Employment Change data, which showed that the private sector hired 183K workers in January, higher than estimates of 150K and the prior release of 176K, revised significantly higher from 122K.
US Dollar PRICE Today
The table below shows the percentage change of US Dollar (USD) against listed major currencies today. US Dollar was the strongest against the Canadian Dollar.
| USD | EUR | GBP | JPY | CAD | AUD | NZD | CHF | |
|---|---|---|---|---|---|---|---|---|
| USD | -0.21% | -0.26% | -0.78% | -0.19% | -0.28% | -0.51% | -0.22% | |
| EUR | 0.21% | -0.05% | -0.59% | 0.02% | -0.06% | -0.29% | -0.01% | |
| GBP | 0.26% | 0.05% | -0.56% | 0.07% | -0.02% | -0.25% | 0.04% | |
| JPY | 0.78% | 0.59% | 0.56% | 0.61% | 0.52% | 0.27% | 0.57% | |
| CAD | 0.19% | -0.02% | -0.07% | -0.61% | -0.08% | -0.32% | -0.03% | |
| AUD | 0.28% | 0.06% | 0.02% | -0.52% | 0.08% | -0.23% | 0.05% | |
| NZD | 0.51% | 0.29% | 0.25% | -0.27% | 0.32% | 0.23% | 0.29% | |
| CHF | 0.22% | 0.01% | -0.04% | -0.57% | 0.03% | -0.05% | -0.29% |
The heat map shows percentage changes of major currencies against each other. The base currency is picked from the left column, while the quote currency is picked from the top row. For example, if you pick the US Dollar from the left column and move along the horizontal line to the Japanese Yen, the percentage change displayed in the box will represent USD (base)/JPY (quote).
Meanwhile, the outlook of the New Zealand Dollar (NZD) remains uncertain as the impact of a trade war between the US and China will also be borne by the New Zealand economy, being one of the leading trading partners of China.
On the monetary policy front, market participants expect the Reserve Bank of New Zealand (RBNZ) to continue reducing its cash rate to reduce deepening risks of inflation undershooting their target of 2%.
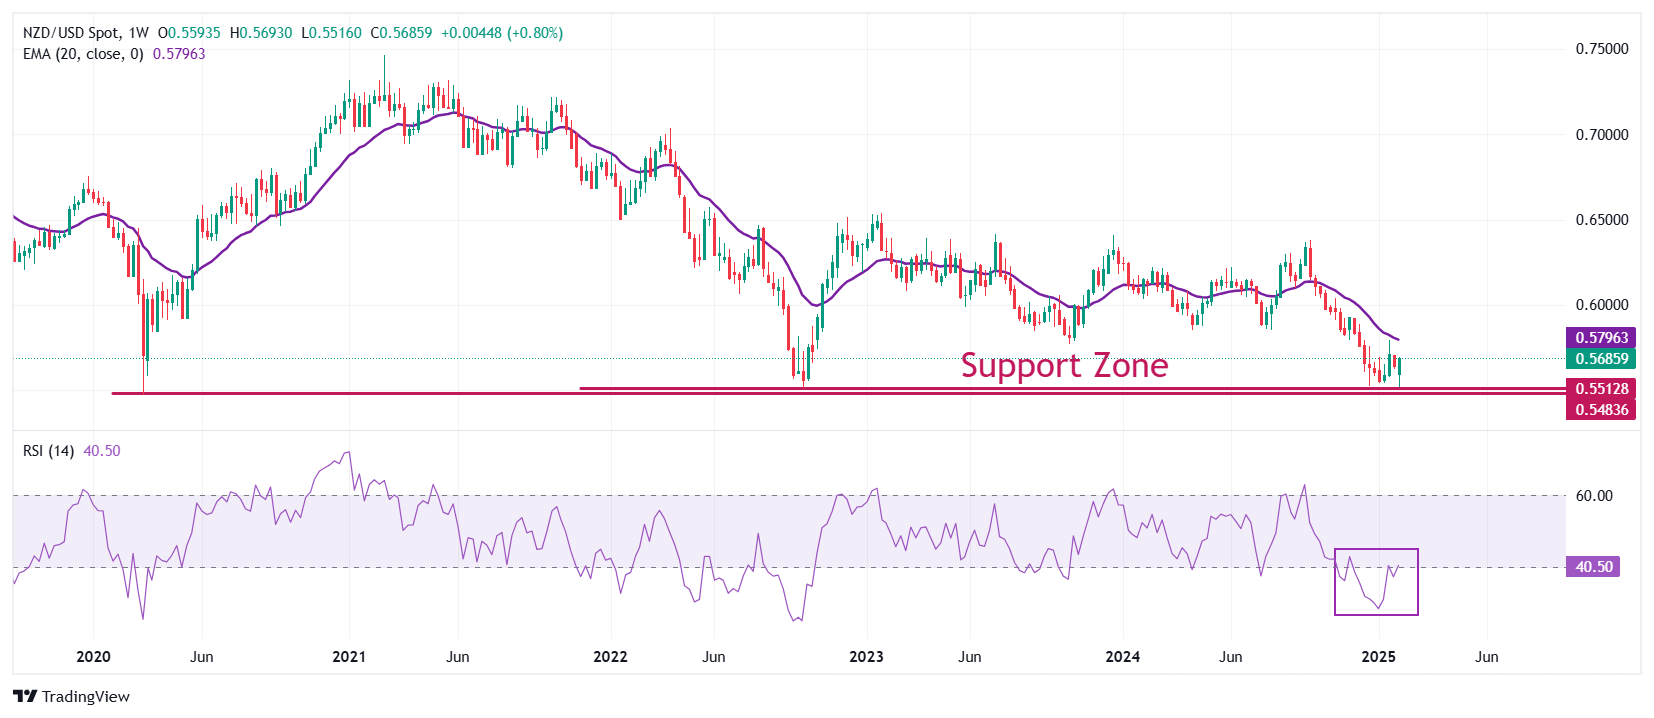
NZD/USD rebounds strongly from the support zone plotted around 0.5500 on a weekly timeframe. However, the outlook of the Kiwi pair is still bearish as the 20-week Exponential Moving Average (EMA) near 0.5800 is sloping downwards.
The 14-week Relative Strength Index (RSI) attempts to return inside the 40.00-60.00 range. A fresh bearish momentum would trigger if the RSI fails to do the same.
The Kiwi pair could decline to nears round-level supports of 0.5400 and 0.5300 if it breaks below the 13-year low of 0.5470.
On the flip side, a decisive break above the November 29 high of 0.5930 could drive the pair to the November 15 high of 0.5970 and the psychological resistance of 0.6000.
NZD/USD weekly chart
US-China Trade War FAQs
Generally speaking, a trade war is an economic conflict between two or more countries due to extreme protectionism on one end. It implies the creation of trade barriers, such as tariffs, which result in counter-barriers, escalating import costs, and hence the cost of living.
An economic conflict between the United States (US) and China began early in 2018, when President Donald Trump set trade barriers on China, claiming unfair commercial practices and intellectual property theft from the Asian giant. China took retaliatory action, imposing tariffs on multiple US goods, such as automobiles and soybeans. Tensions escalated until the two countries signed the US-China Phase One trade deal in January 2020. The agreement required structural reforms and other changes to China’s economic and trade regime and pretended to restore stability and trust between the two nations. However, the Coronavirus pandemic took the focus out of the conflict. Yet, it is worth mentioning that President Joe Biden, who took office after Trump, kept tariffs in place and even added some additional levies.
The return of Donald Trump to the White House as the 47th US President has sparked a fresh wave of tensions between the two countries. During the 2024 election campaign, Trump pledged to impose 60% tariffs on China once he returned to office, which he did on January 20, 2025. With Trump back, the US-China trade war is meant to resume where it was left, with tit-for-tat policies affecting the global economic landscape amid disruptions in global supply chains, resulting in a reduction in spending, particularly investment, and directly feeding into the Consumer Price Index inflation.