
提供最佳价差和条件
 了解更多
了解更多

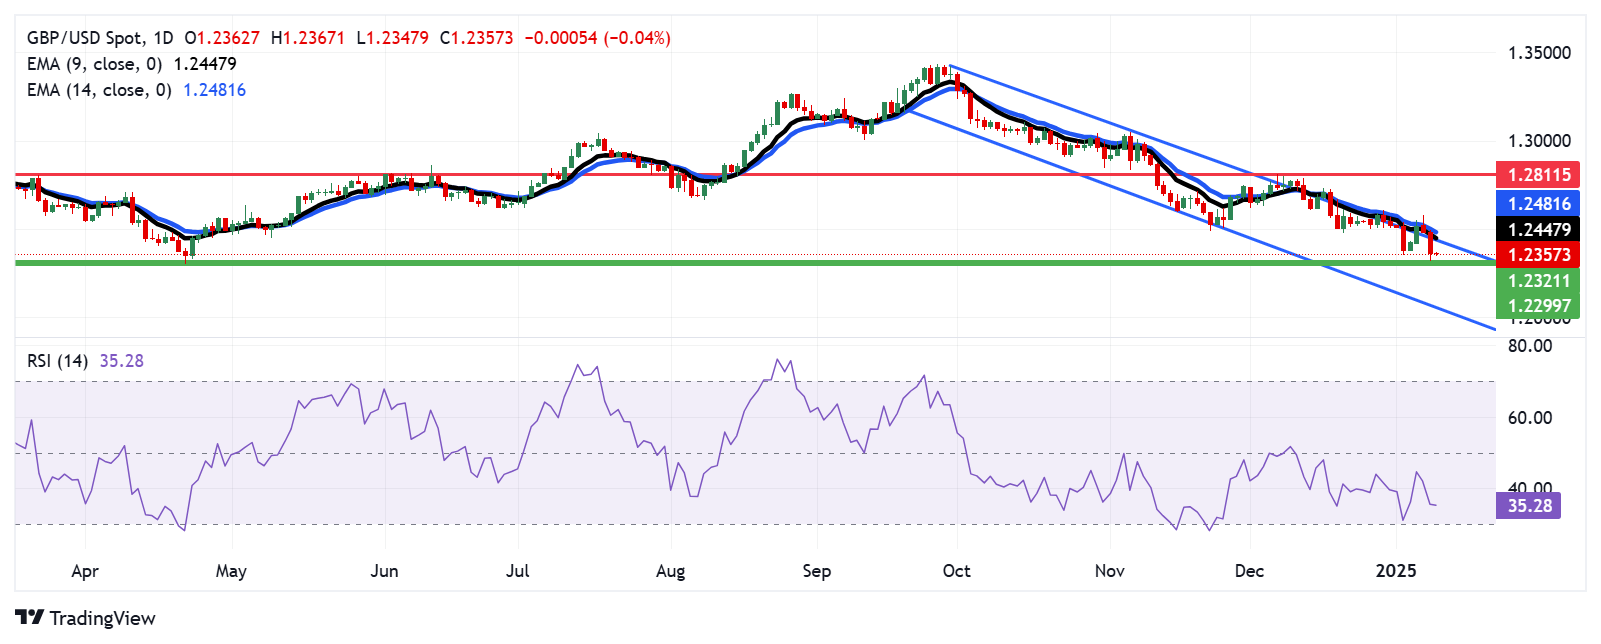
The GBP/USD pair remains under pressure for the third consecutive session, hovering near 1.2360 during Thursday's Asian trading hours. Technical analysis of the daily chart highlights a prevailing bearish bias, with the pair falling back to the descending channel pattern.
The 14-day Relative Strength Index (RSI) approaches the 30 mark, signaling intensified bearish momentum. Additionally, the GBP/USD pair trades below the nine- and 14-day Exponential Moving Averages (EMAs), reflecting weak short-term price dynamics.
On the downside, the GBP/USD pair could test the nine-month low of 1.2321, recorded on January 8, followed by the next support level at 1.2299, the lowest since November 2023, last observed on April 22. A break below this level could strengthen bearish sentiment, potentially driving the pair toward the lower boundary of the descending channel near 1.2050.
On the upside, the GBP/USD pair may encounter immediate resistance at the descending channel's upper boundary, near the nine-day EMA at 1.2449, followed by the 14-day EMA at 1.2482. A decisive breakout above this critical resistance zone could enhance short-term price momentum, paving the way for a potential move toward the two-month high of 1.2811, reached on December 6.
The table below shows the percentage change of British Pound (GBP) against listed major currencies today. British Pound was the weakest against the Japanese Yen.
| USD | EUR | GBP | JPY | CAD | AUD | NZD | CHF | |
|---|---|---|---|---|---|---|---|---|
| USD | -0.03% | 0.04% | -0.27% | -0.12% | 0.14% | 0.06% | -0.19% | |
| EUR | 0.03% | 0.07% | -0.23% | -0.09% | 0.18% | 0.09% | -0.16% | |
| GBP | -0.04% | -0.07% | -0.33% | -0.16% | 0.10% | 0.03% | -0.21% | |
| JPY | 0.27% | 0.23% | 0.33% | 0.14% | 0.41% | 0.29% | 0.10% | |
| CAD | 0.12% | 0.09% | 0.16% | -0.14% | 0.27% | 0.18% | -0.05% | |
| AUD | -0.14% | -0.18% | -0.10% | -0.41% | -0.27% | -0.09% | -0.31% | |
| NZD | -0.06% | -0.09% | -0.03% | -0.29% | -0.18% | 0.09% | -0.22% | |
| CHF | 0.19% | 0.16% | 0.21% | -0.10% | 0.05% | 0.31% | 0.22% |
The heat map shows percentage changes of major currencies against each other. The base currency is picked from the left column, while the quote currency is picked from the top row. For example, if you pick the British Pound from the left column and move along the horizontal line to the US Dollar, the percentage change displayed in the box will represent GBP (base)/USD (quote).


