

Silver Price Forecast: XAG/USD bears have the upper hand while below 200-day SMA near $30.00
- Silver kicks off the new week on a weaker note and seems vulnerable to weakening further.
- The recent failures near the 200-day SMA validate the negative outlook for the XAG/USD.
- A sustained strength beyond the $30.00 mark is needed to negate the near-term bearish bias.
Silver (XAG/USD) extends Friday's modest pullback from the vicinity of the $30.00 psychological mark and edges lower at the start of a new week. The white metal drops below the mid-$29.00s during the Asian session and now seems to have stalled its recovery from a multi-month trough touched in December.
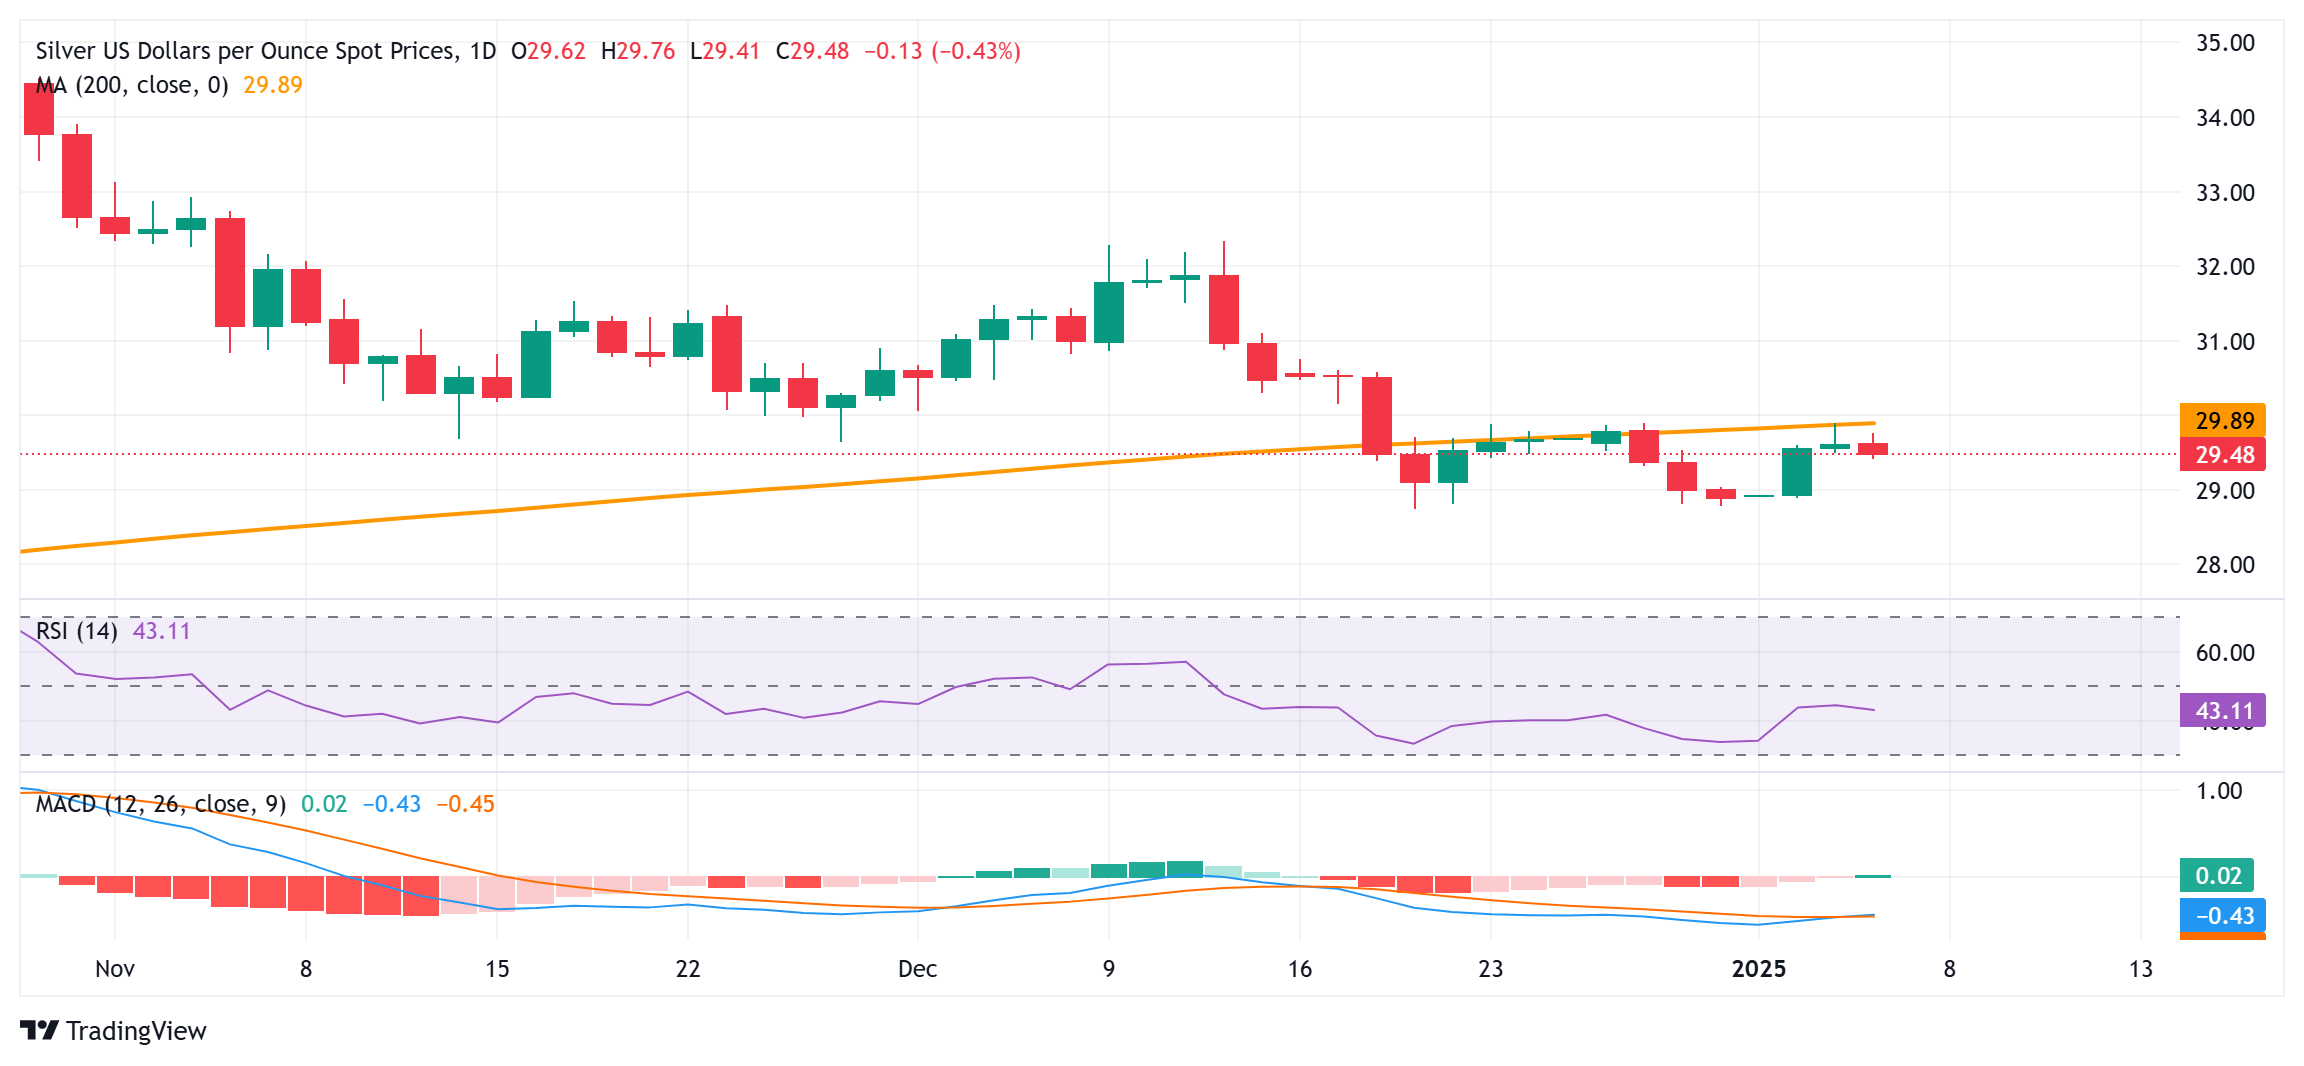
From a technical perspective, the recent breakdown and repeated failures near the 200-day Simple Moving Average (SMA) favor bearish traders. This, along with the fact that oscillators on the daily chart are holding in negative territory, suggests that the path of least resistance for the XAG/USD is to the downside. Some follow-through selling below the $29.40 area will reaffirm the outlook and make the commodity vulnerable to weakening towards the $29.00 mark.
The downside trajectory could extend further towards the $28.75-$28.70 region, or the multi-month low, which should act as a key pivotal point. A sustained break below will set the stage for an extension of a well-established downtrend from the $35.00 neighborhood, or a multi-year peak touched in October.
On the flip side, the $30.00 mark (200-day SMA) might continue to act as an immediate strong barrier, above a bout of a short-covering could lift the XAG/USD to the next relevant hurdle near the $30.50 area. The momentum could eventually allow the white metal to reclaim the $31.00 mark and test the $31.15-$31.20 supply zone.
Silver daily chart
Silver FAQs
Silver is a precious metal highly traded among investors. It has been historically used as a store of value and a medium of exchange. Although less popular than Gold, traders may turn to Silver to diversify their investment portfolio, for its intrinsic value or as a potential hedge during high-inflation periods. Investors can buy physical Silver, in coins or in bars, or trade it through vehicles such as Exchange Traded Funds, which track its price on international markets.
Silver prices can move due to a wide range of factors. Geopolitical instability or fears of a deep recession can make Silver price escalate due to its safe-haven status, although to a lesser extent than Gold's. As a yieldless asset, Silver tends to rise with lower interest rates. Its moves also depend on how the US Dollar (USD) behaves as the asset is priced in dollars (XAG/USD). A strong Dollar tends to keep the price of Silver at bay, whereas a weaker Dollar is likely to propel prices up. Other factors such as investment demand, mining supply – Silver is much more abundant than Gold – and recycling rates can also affect prices.
Silver is widely used in industry, particularly in sectors such as electronics or solar energy, as it has one of the highest electric conductivity of all metals – more than Copper and Gold. A surge in demand can increase prices, while a decline tends to lower them. Dynamics in the US, Chinese and Indian economies can also contribute to price swings: for the US and particularly China, their big industrial sectors use Silver in various processes; in India, consumers’ demand for the precious metal for jewellery also plays a key role in setting prices.
Silver prices tend to follow Gold's moves. When Gold prices rise, Silver typically follows suit, as their status as safe-haven assets is similar. The Gold/Silver ratio, which shows the number of ounces of Silver needed to equal the value of one ounce of Gold, may help to determine the relative valuation between both metals. Some investors may consider a high ratio as an indicator that Silver is undervalued, or Gold is overvalued. On the contrary, a low ratio might suggest that Gold is undervalued relative to Silver.