

GBP/USD Price Forecast: Retreats below 1.2750 amid strong US Dollar
- Cable slides 0.17%, unable to sustain gains against a strengthening US Dollar Index, now at 106.36.
- GBP/USD's failure to surpass the 200-day SMA at 1.2820 signals potential for further pullback.
- Downward pressure increases, with possible support targets at 1.2600 and the November 22 low of 1.2486.
The Pound Sterling tumbled after failing to clear the 1.2800 figure for the third consecutive day, trading at 1.2720, down over 0.17% daily. Cable erased its earlier minuscule gains amid a session characterized by US Dollar strength, with the US Dollar Index (DXY) up over 0.19%, at 106.36.
GBP/USD Price Forecast: Technical outlook
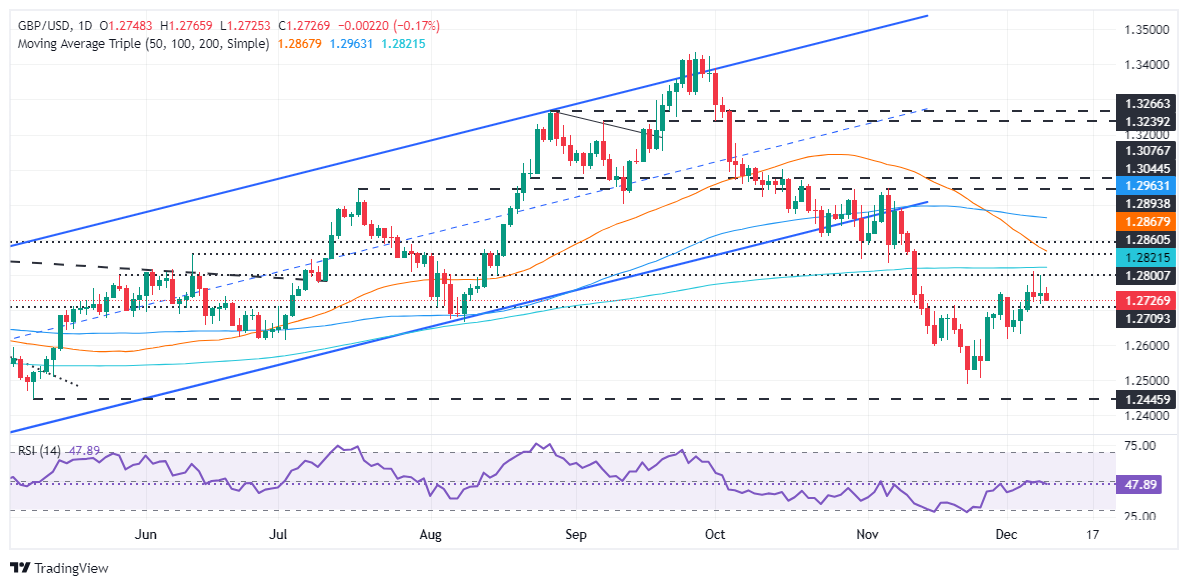
The GBP/USD consolidates as it recovers from falling to multi-month lows at around 1.2480s. On its way north, the pair cleared the 1.2600 figure and November 29 peak of 1.2749 before aiming toward the December 6 high at 1.2811. The failure to extend its gains past the 200-day Simple Moving Average (SMA) of 1.2820 opened the door for a pullback to current spot prices.
On the other hand, sellers are moving in, as shown by the Relative Strength Index (RSI) punching below its neutral line, indicating that they’re gathering steam. If GBP/USD drops below 1.2700, the pair could slide towards 1.2600 before challenging the November 22 swing low of 1.2486.
GBP/USD Price Chart – Daily
British Pound PRICE Today
The table below shows the percentage change of British Pound (GBP) against listed major currencies today. British Pound was the strongest against the New Zealand Dollar.
| USD | EUR | GBP | JPY | CAD | AUD | NZD | CHF | |
|---|---|---|---|---|---|---|---|---|
| USD | 0.46% | 0.17% | 0.55% | 0.15% | 1.03% | 1.15% | 0.44% | |
| EUR | -0.46% | -0.28% | 0.08% | -0.32% | 0.57% | 0.69% | -0.01% | |
| GBP | -0.17% | 0.28% | 0.33% | -0.03% | 0.85% | 0.97% | 0.27% | |
| JPY | -0.55% | -0.08% | -0.33% | -0.39% | 0.50% | 0.60% | -0.09% | |
| CAD | -0.15% | 0.32% | 0.03% | 0.39% | 0.89% | 1.01% | 0.31% | |
| AUD | -1.03% | -0.57% | -0.85% | -0.50% | -0.89% | 0.12% | -0.58% | |
| NZD | -1.15% | -0.69% | -0.97% | -0.60% | -1.01% | -0.12% | -0.69% | |
| CHF | -0.44% | 0.01% | -0.27% | 0.09% | -0.31% | 0.58% | 0.69% |
The heat map shows percentage changes of major currencies against each other. The base currency is picked from the left column, while the quote currency is picked from the top row. For example, if you pick the British Pound from the left column and move along the horizontal line to the US Dollar, the percentage change displayed in the box will represent GBP (base)/USD (quote).