确认您不是来自美国或菲律宾

在此声明,本人明确声明并确认:
  • 我不是美国公民或居民
  • 我不是菲律宾居民
  • 本人没有直接或间接拥有美国居民10%以上的股份/投票权/权益,和/或没有通过其他方式控制美国公民或居民。
  • 本人没有直接或间接的美国公民或居民10%以上的股份/投票权/权益的所有权,和/或受美国公民或居民其他任何方式行使的控制。
  • 根据FATCA 1504(a)对附属关系的定义,本人与美国公民或居民没有任何附属关系。
  • 我知道做出虚假声明所需付的责任。
就本声明而言,所有美国附属国家和地区均等同于美国的主要领土。本人承诺保护Octa Markets Incorporated及其董事和高级职员免受因违反本声明而产生或与之相关的任何索赔。
我们致力于保护您的隐私和您个人信息的安全。我们只收集电子邮件,以提供有关我们产品和服务的特别优惠和重要信息。通过提交您的电子邮件地址,您同意接收我们的此类信件。如果您想取消订阅或有任何问题或疑虑,请联系我们的客户支持。
Octa trading broker
开通交易账户
Test

disclaimer_saint_lucia_header

disclaimer_saint_lucia_description

Back

GBP/USD Price Analysis: Remains close to over two-month peak, bullish potential intact

  • GBP/USD attracts fresh buying on Wednesday amid the underlying USD bearish tone.
  • Divergent Fed-BoE policy expectations turn out to be another factor lending support.
  • The technical setup favors bullish traders and supports prospects for additional gains.

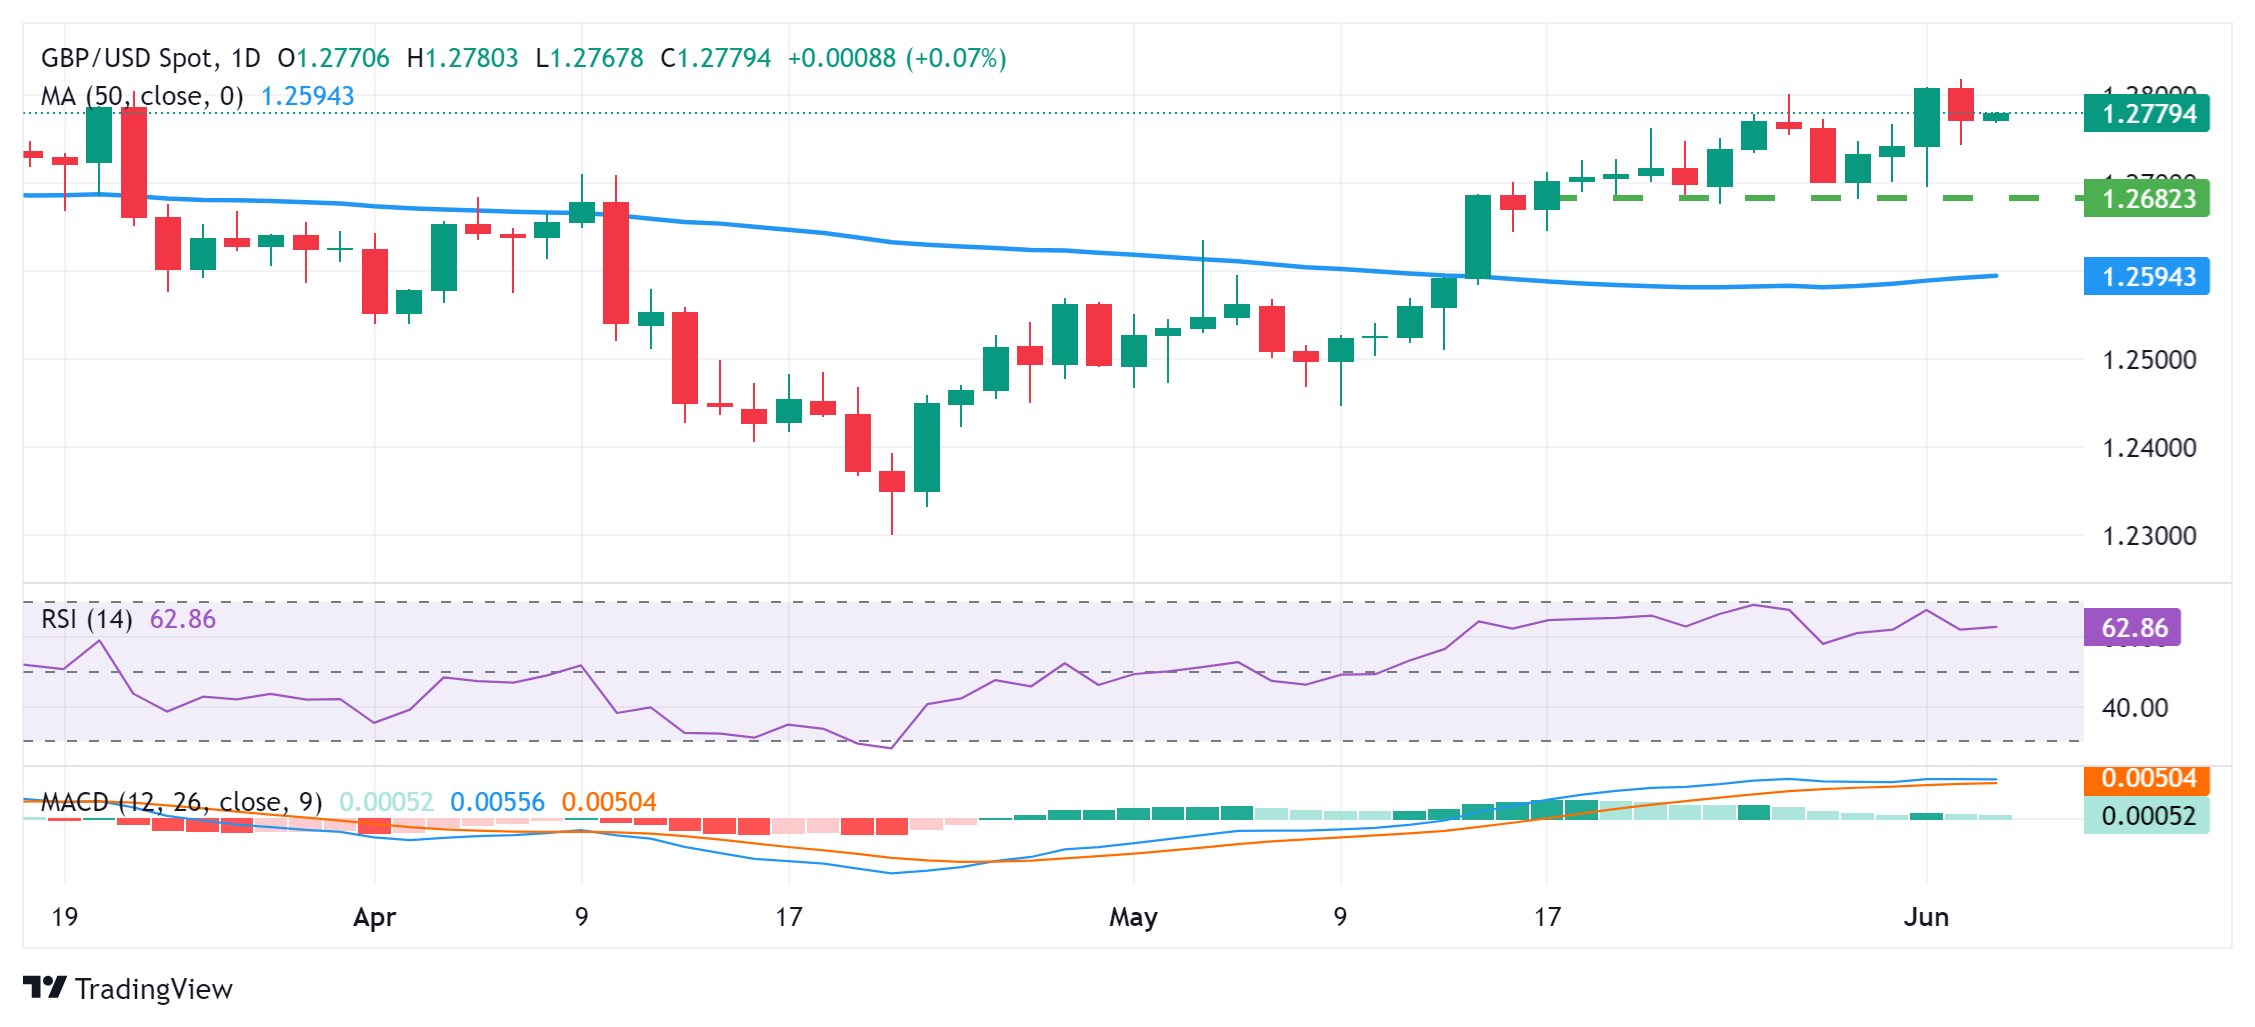
The GBP/USD pair trades with a mild positive bias around the 1.2775-1.2780 area during the Asian session on Wednesday and remains well within the striking distance of its highest level since March 14 touched the previous day.

The US Dollar (USD) struggles to capitalize on the overnight bounce from over a two-month low in the wake of rising bets for an imminent interest rate cut by the Federal Reserve (Fed) later this year. Furthermore, expectations that the Bank of England (BoE) might keep interest rates at their current level for a little bit longer continue to underpin the British Pound (GBP) and act as a tailwind for the GBP/USD pair. 

From a technical perspective, oscillators on the daily chart are holding in the positive territory and are still away from being in the overbought zone. This, in turn, supports prospects for further gains. Some follow-through buying beyond the 1.2800 mark will reaffirm the positive bias and lift the GBP/USD pair to the 1.2855-1.2860 area en route to the 1.2900 neighborhood or the YTD peak touched in March.

On the flip side, the overnight swing low, around the 1.2745-1.2740 region, now seems to protect the immediate downside ahead of the 1.2725-1.2720 area. The latter is followed by the 1.2700 mark, which if broken should pave the way for a slide towards the next relevant support near mid-1.2600s. Spot prices might eventually drop to test sub-1.2600 levels, or the 50-day Simple Moving Average (SMA) support.

GBP/USD daily chart

fxsoriginal

GBP/USD

Overview
Today last price 1.278
Today Daily Change 0.0009
Today Daily Change % 0.07
Today daily open 1.2771
 
Trends
Daily SMA20 1.268
Daily SMA50 1.2592
Daily SMA100 1.2636
Daily SMA200 1.2544
 
Levels
Previous Daily High 1.2818
Previous Daily Low 1.2743
Previous Weekly High 1.2801
Previous Weekly Low 1.2681
Previous Monthly High 1.2801
Previous Monthly Low 1.2446
Daily Fibonacci 38.2% 1.2772
Daily Fibonacci 61.8% 1.2789
Daily Pivot Point S1 1.2736
Daily Pivot Point S2 1.2702
Daily Pivot Point S3 1.2662
Daily Pivot Point R1 1.2811
Daily Pivot Point R2 1.2852
Daily Pivot Point R3 1.2886


Australian Dollar appreciates despite lower GDP Q1

The Australian Dollar (AUD) gains ground following the lower-than-expected Gross Domestic Product data, which grew 0.1% QoQ in the first quarter, against the expected 0.2% reading.
了解更多 Previous

Australian Treasurer Chalmers: Q2 GDP to be similarly difficult'

Australian Treasurer Jim Chalmers said on Wednesday that he expects “the second-quarter GDP to be `similarly difficult'.
了解更多 Next