确认您不是来自美国或菲律宾

在此声明,本人明确声明并确认:
  • 我不是美国公民或居民
  • 我不是菲律宾居民
  • 本人没有直接或间接拥有美国居民10%以上的股份/投票权/权益,和/或没有通过其他方式控制美国公民或居民。
  • 本人没有直接或间接的美国公民或居民10%以上的股份/投票权/权益的所有权,和/或受美国公民或居民其他任何方式行使的控制。
  • 根据FATCA 1504(a)对附属关系的定义,本人与美国公民或居民没有任何附属关系。
  • 我知道做出虚假声明所需付的责任。
就本声明而言,所有美国附属国家和地区均等同于美国的主要领土。本人承诺保护Octa Markets Incorporated及其董事和高级职员免受因违反本声明而产生或与之相关的任何索赔。
我们致力于保护您的隐私和您个人信息的安全。我们只收集电子邮件,以提供有关我们产品和服务的特别优惠和重要信息。通过提交您的电子邮件地址,您同意接收我们的此类信件。如果您想取消订阅或有任何问题或疑虑,请联系我们的客户支持。
Octa trading broker
开通交易账户
Back

USD/CAD Price Analysis: Rises toward 1.3700 despite a bearish bias

  • USD/CAD gains ground despite a bearish bias suggested by daily chart analysis.
  • The momentum indicator MACD also suggests a bearish trend for the pair.
  • A break above the upper boundary of the descending channel and the psychological level of 1.3700 could weaken the bearish bias.

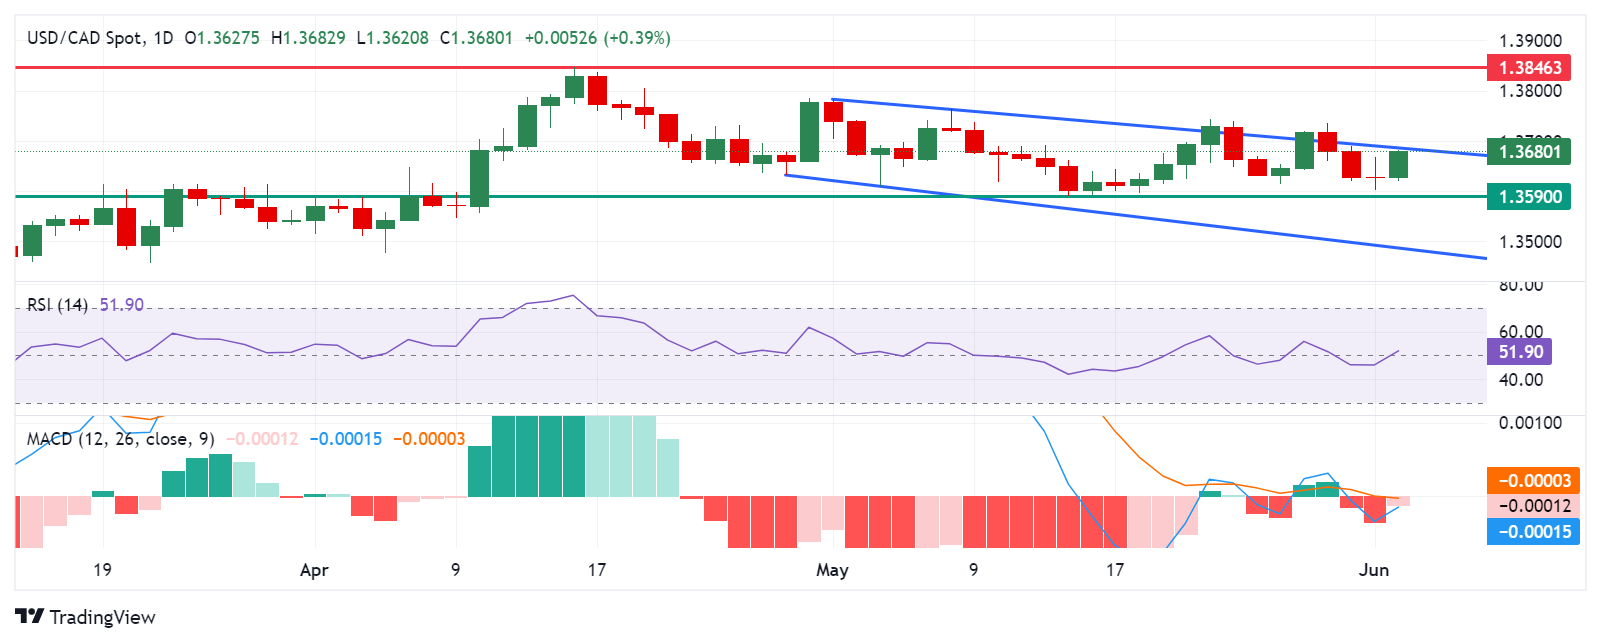
USD/CAD halts its three-day losing streak, trading around 1.3680 during the European hours on Tuesday. The appreciation of the pair is attributed to the decline in crude Oil prices, given the fact that Canada is the largest Oil exporter to the United States (US).

The analysis of the daily chart suggests the bearish bias for the USD/CAD pair, as it lies within the descending channel. Additionally, the 14-day Relative Strength Index (RSI) is positioned slightly above the 50 level, further movement may offer a clear directional trend.

The momentum indicator Moving Average Convergence Divergence (MACD) also suggests a bearish trend for the USD/CAD pair as the MACD line is positioned below the centerline and the signal line. However, the convergence below the signal line could lead to a momentum shift. A breakthrough above the centerline could weaken the bearish trend.

The USD/CAD pair could find the key support around the psychological level of 1.3600 and a throwback support of 1.3590. A break below this region could exert downward pressure on the pair to navigate around the significant level of 1.3500. Further support may appear at the lower threshold of the descending channel.

On the upside, the USD/CAD pair tests the upper boundary of the descending channel, followed by the psychological level of 1.3700. A breakthrough above the latter could weaken the bearish bias and lead the pair to explore the region around the key level of 1.3800, followed by April’s high of 1.3846.

USD/CAD: Daily Chart

USD/CAD

Overview
Today last price 1.3679
Today Daily Change 0.0052
Today Daily Change % 0.38
Today daily open 1.3627
 
Trends
Daily SMA20 1.3662
Daily SMA50 1.3662
Daily SMA100 1.3582
Daily SMA200 1.3575
 
Levels
Previous Daily High 1.3669
Previous Daily Low 1.3603
Previous Weekly High 1.3735
Previous Weekly Low 1.3615
Previous Monthly High 1.3783
Previous Monthly Low 1.359
Daily Fibonacci 38.2% 1.3628
Daily Fibonacci 61.8% 1.3644
Daily Pivot Point S1 1.3597
Daily Pivot Point S2 1.3567
Daily Pivot Point S3 1.3532
Daily Pivot Point R1 1.3663
Daily Pivot Point R2 1.3699
Daily Pivot Point R3 1.3729


NZD/USD Price Analysis: Tests Bullish Flag breakout region

The NZD/USD pair corrects modestly from fresh almost three-month high of 0.6200 in Tuesday’s European session.
了解更多 Previous

Silver price today: Silver declines, according to FXStreet data

Silver prices (XAG/USD) fell on Tuesday, according to FXStreet data.
了解更多 Next