确认您不是来自美国或菲律宾

在此声明,本人明确声明并确认:
  • 我不是美国公民或居民
  • 我不是菲律宾居民
  • 本人没有直接或间接拥有美国居民10%以上的股份/投票权/权益,和/或没有通过其他方式控制美国公民或居民。
  • 本人没有直接或间接的美国公民或居民10%以上的股份/投票权/权益的所有权,和/或受美国公民或居民其他任何方式行使的控制。
  • 根据FATCA 1504(a)对附属关系的定义,本人与美国公民或居民没有任何附属关系。
  • 我知道做出虚假声明所需付的责任。
就本声明而言,所有美国附属国家和地区均等同于美国的主要领土。本人承诺保护Octa Markets Incorporated及其董事和高级职员免受因违反本声明而产生或与之相关的任何索赔。
我们致力于保护您的隐私和您个人信息的安全。我们只收集电子邮件,以提供有关我们产品和服务的特别优惠和重要信息。通过提交您的电子邮件地址,您同意接收我们的此类信件。如果您想取消订阅或有任何问题或疑虑,请联系我们的客户支持。
Octa trading broker
开通交易账户
Back

AUD/JPY Price Analysis: Bulls gather momentum, consolidation ongoing

  • Daily chart indicators suggest a positive incline; RSI climbs up.
  • Hourly chart indicators flatten out in positive territory, indicating consolidation after recent gains.
  • The pair is seeing signs of bullish exhaustion after recent gains, with eyes set on support around the 103.60-103.80 area.

In Friday's trading session, the AUD/JPY pair soared to the 104.50 region owing to positive momentum, reinforcing expectations of an overall bullish landscape. However, the market's upward trajectory is showing signs of fatigue, and the pair has entered in a consolidation phase.

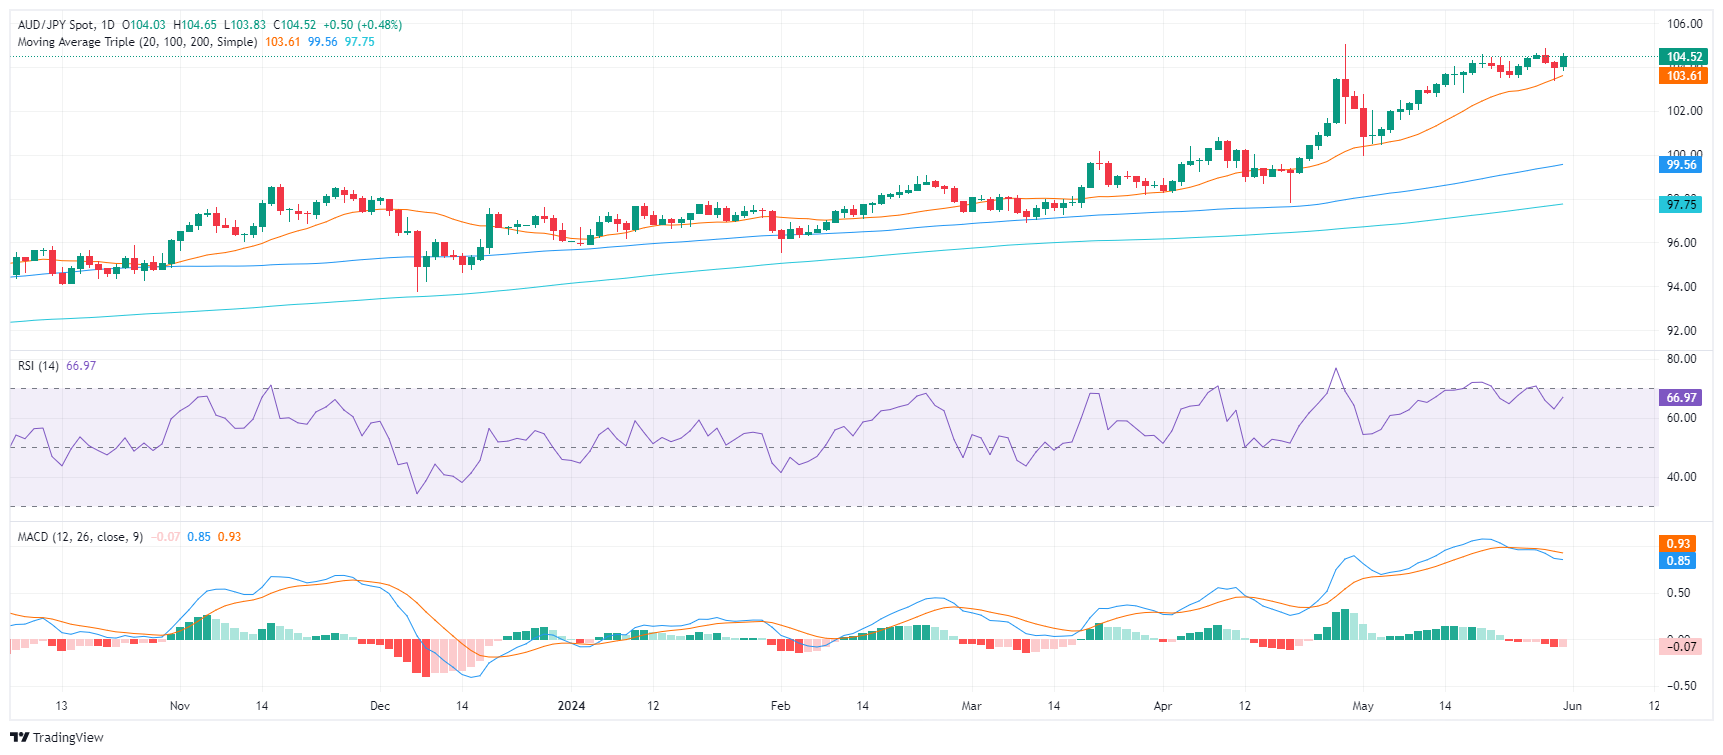
As per the daily chart, the RSI has ascended near to the 70 region, presenting a slight recovery from Wednesday's drop to 67, suggesting a potential halt to the previous downtrend. Corresponding with this, the MACD prints flat red bars, indicating a possible pause in the market's selling traction.

AUD/JPY daily chart
Confirming these dynamics is the hourly chart. The RSI and MACD are greener and have flattened, indicating a potential period of consolidation following the recent rally.

AUD/JPY hourly chart
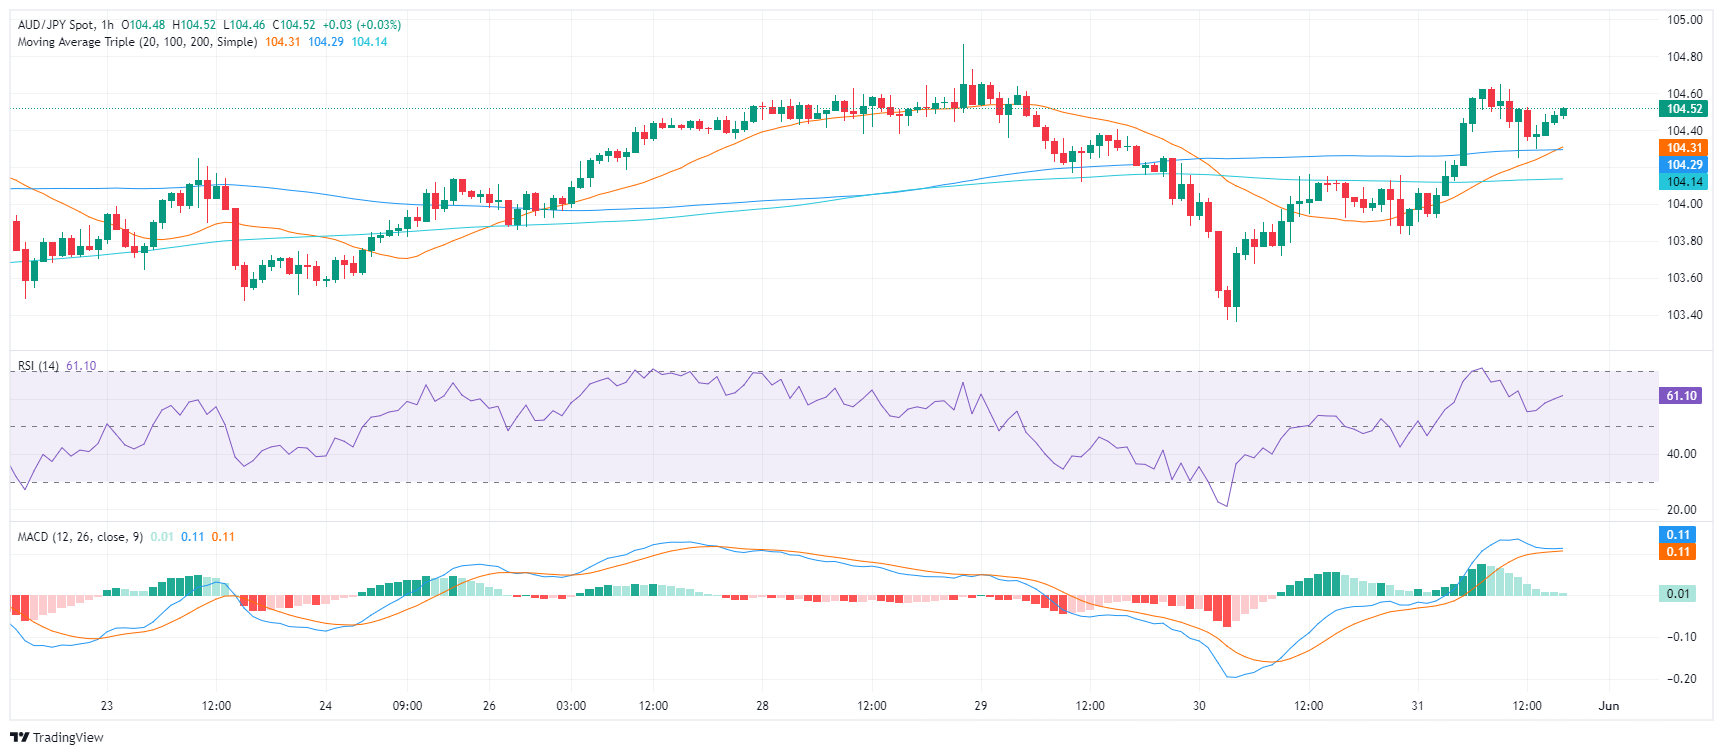
In retrospect to the session on Thursday, sellers were repelled at the 20-day SMA mark of 103.60 and again on Friday at 103.80. These developments have set a formidable support base around that region, which appears could be leveraged to stabilize the recent gains. Any downturn below the 20-day SMA may risk undermining the short-term bullish atmosphere.

AUD/JPY

Overview
Today last price 104.5
Today Daily Change 0.48
Today Daily Change % 0.46
Today daily open 104.02
 
Trends
Daily SMA20 103.44
Daily SMA50 101.33
Daily SMA100 99.48
Daily SMA200 97.7
 
Levels
Previous Daily High 104.26
Previous Daily Low 103.36
Previous Weekly High 104.56
Previous Weekly Low 103.48
Previous Monthly High 105.04
Previous Monthly Low 97.78
Daily Fibonacci 38.2% 103.7
Daily Fibonacci 61.8% 103.91
Daily Pivot Point S1 103.5
Daily Pivot Point S2 102.98
Daily Pivot Point S3 102.6
Daily Pivot Point R1 104.4
Daily Pivot Point R2 104.77
Daily Pivot Point R3 105.29


Canadian Dollar bolstered by weakened Greenback despite softer Canadian GDP

The Canadian Dollar (CAD) is broadly higher on Friday, but gains are capped after softer-than-expected prints in Canadian economic data.
了解更多 Previous

Dow Jones Industrial Average recovers ground after a loss-heavy week

The Dow Jones Industrial Average (DJIA) rebounded over 250 points on Friday as investor sentiment turned higher after US Personal Consumption Expenditures (PCE) Price Index inflation eased faster than expected.
了解更多 Next