

EUR/JPY Price Analysis: Cross faces further correction as bulls retreat
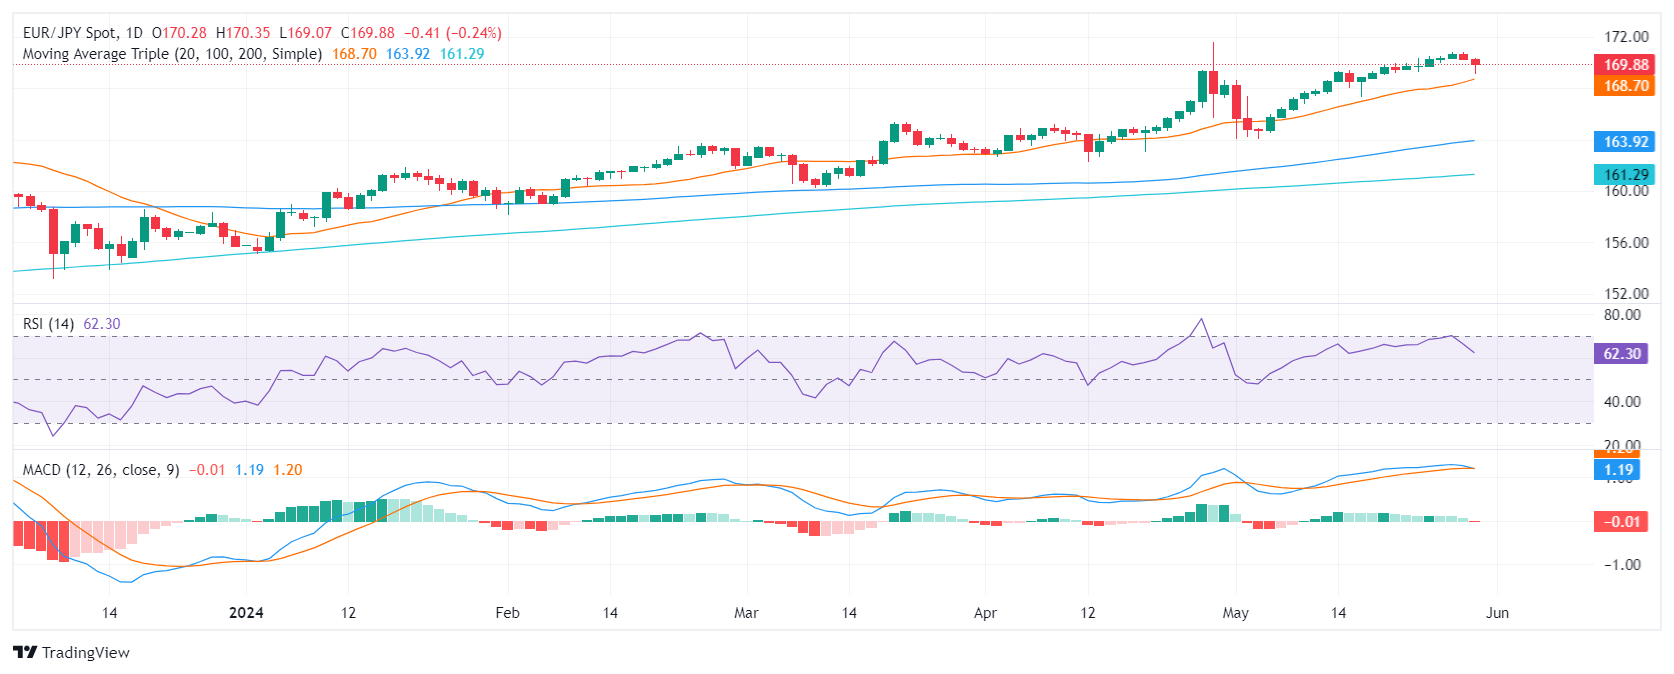
- The daily RSI is pointing downwards, standing near 70, and the MACD has printed a fresh red bar, indicating a deeper consolidation phase.
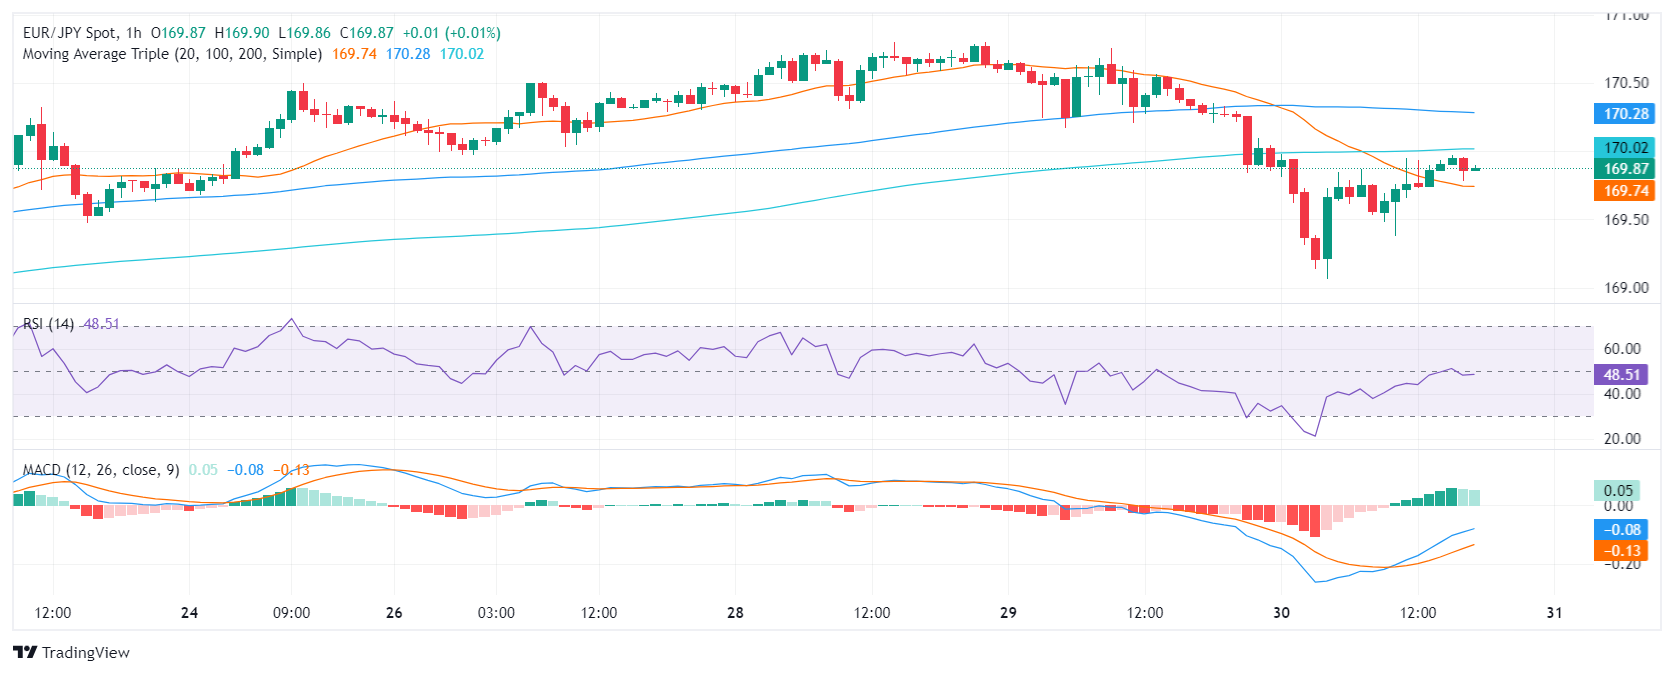
- On the hourly chart, indicators have flattened in the negative terrain, affirming an extended correction phase.
- The EUR/JPY's position above main SMAs continues to support a long-term bullish sentiment.
During Thursday's session, the EUR/JPY pair extended its correction to a daily low of 169.00 before stabilizing around 170.00. This indicates a continuation of the previous session's retreating bullish momentum. The main focus should be observed around the 170-169.00 range, anticipating further correction movements before confirming alterations to the trend.
In the daily analysis, the Relative Strength Index (RSI) and the Moving Average Convergence Divergence (MACD) point toward a deeper correction phase. The RSI is pointing downwards near 70 while the MACD has printed a fresh red bar. Both reflect the curbed bullish trend leading to a consolidation phase.
EUR/JPY daily chart
On the hourly chart, indicators have flattened in the negative area. This signals a reinforcing of the ongoing correction phase, likely a response to recent gains.
EUR/JPY hourly chart
Significantly, the current position of the EUR/JPY pair above the 20-day SMA at 168.70, although being tested, keeps the near-term bullish sentiment intact. Movements below this might fundamentally shift the bullish scenario. Below this market point, the 100 and 200-day SMA provide extra safety barriers for potential sellers.