
提供最佳价差和条件
 了解更多
了解更多

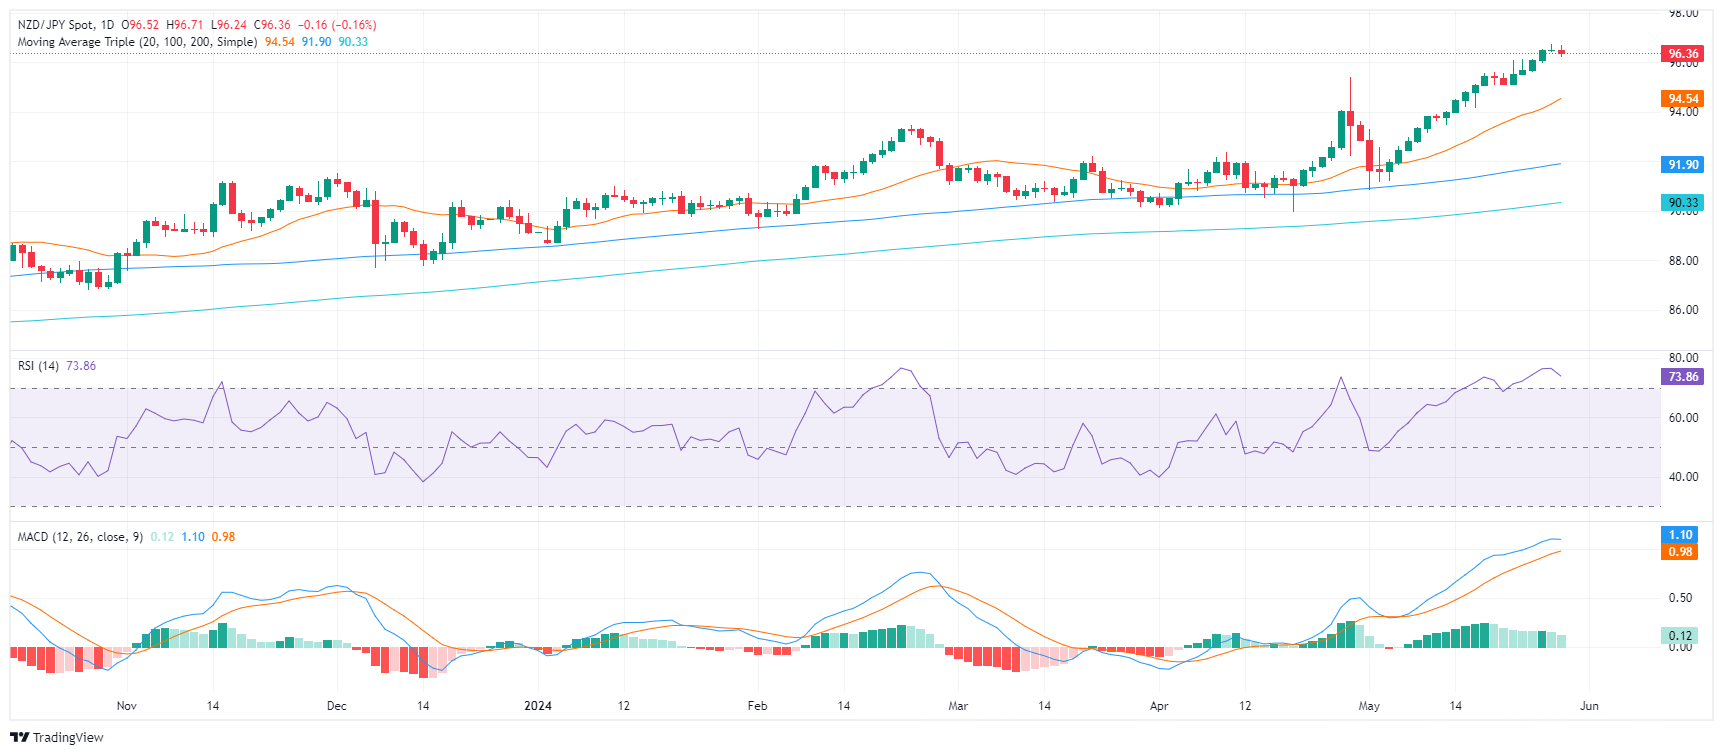
In Wednesday's session, the NZD/JPY pair saw a small correction to 96.40 but remains at its highest level since July 2007 at around 96.70. This adjustment doesn't quite alter the current outlook, merely turning it slightly cautious given the persistent overbought signals, but the overarching bullish trend carries on.
The daily chart's indicators confirm this narrative where the Relative Strength Index (RSI) remains in a deep overbought condition. Meanwhile, the Moving Average Convergence Divergence (MACD) keeps showing sustained positive momentum with its consistent green bars.
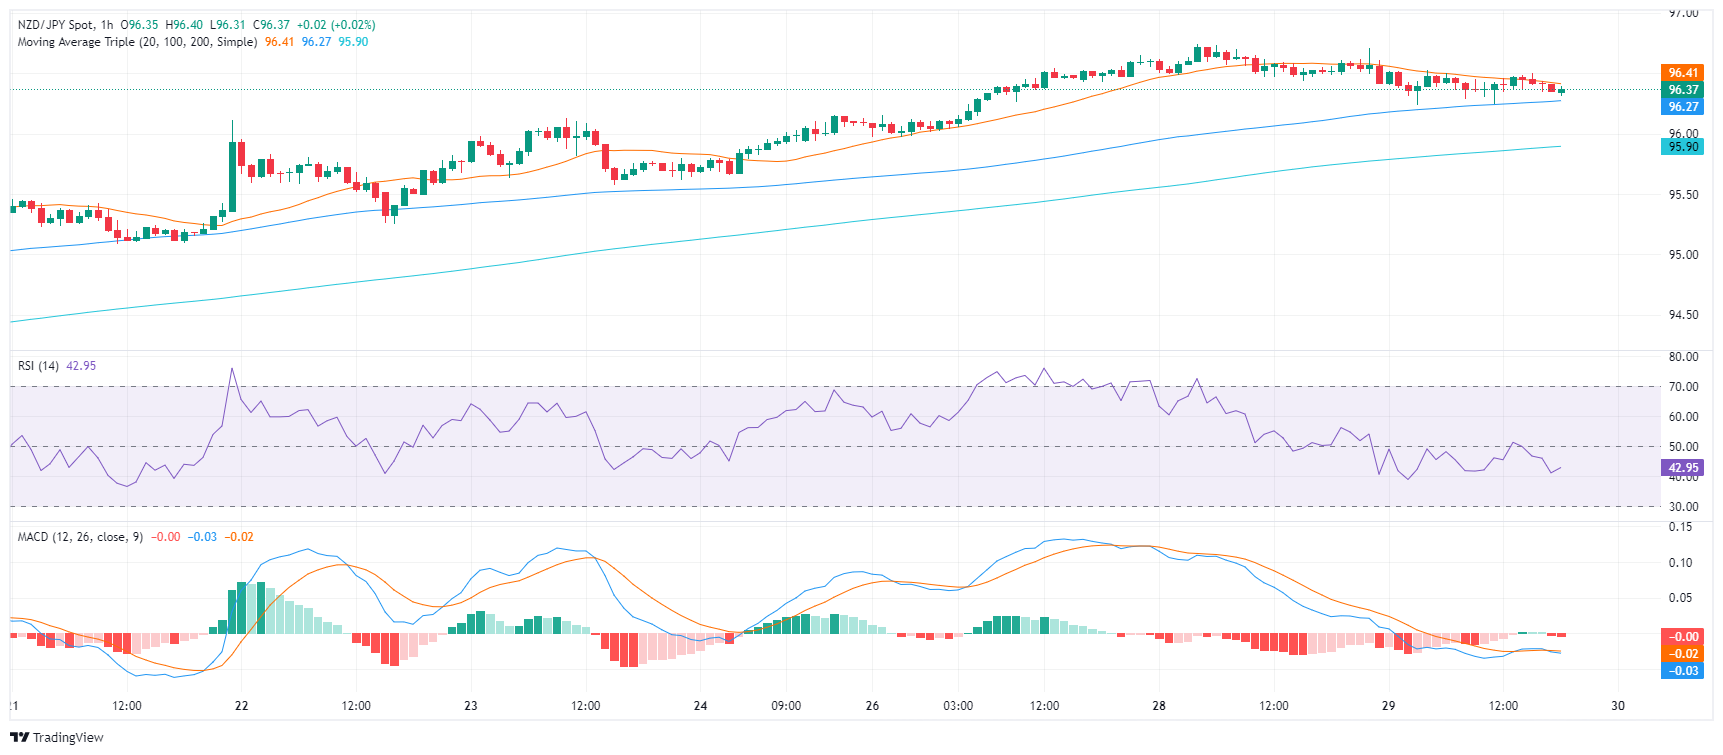
On the hourly chart, there is a visible weakening of strength compared to the daily perspective, and an ongoing edging downward can be observed.
In a broader context, the NZD/JPY continues to display a strong uptrend, as shown by its position above the 20, 100, and 200-day Simple Moving Averages (SMA). Despite the slight correction, the pair's short-term gains still overshadow its medium and long-term averages.
As the looming correction gains momentum, any further downward movements should ideally keep the pair above its SMAs. Crucial to the monitoring is the first strong support level observed at 95.00, which the pair could potentially use to cushion any significant losses.


