确认您不是来自美国或菲律宾

在此声明,本人明确声明并确认:
  • 我不是美国公民或居民
  • 我不是菲律宾居民
  • 本人没有直接或间接拥有美国居民10%以上的股份/投票权/权益,和/或没有通过其他方式控制美国公民或居民。
  • 本人没有直接或间接的美国公民或居民10%以上的股份/投票权/权益的所有权,和/或受美国公民或居民其他任何方式行使的控制。
  • 根据FATCA 1504(a)对附属关系的定义,本人与美国公民或居民没有任何附属关系。
  • 我知道做出虚假声明所需付的责任。
就本声明而言,所有美国附属国家和地区均等同于美国的主要领土。本人承诺保护Octa Markets Incorporated及其董事和高级职员免受因违反本声明而产生或与之相关的任何索赔。
我们致力于保护您的隐私和您个人信息的安全。我们只收集电子邮件,以提供有关我们产品和服务的特别优惠和重要信息。通过提交您的电子邮件地址,您同意接收我们的此类信件。如果您想取消订阅或有任何问题或疑虑,请联系我们的客户支持。
Octa trading broker
开通交易账户
Back

AUD/JPY Price Analysis: Bulls display signs of fatigue, potential shift remains possible

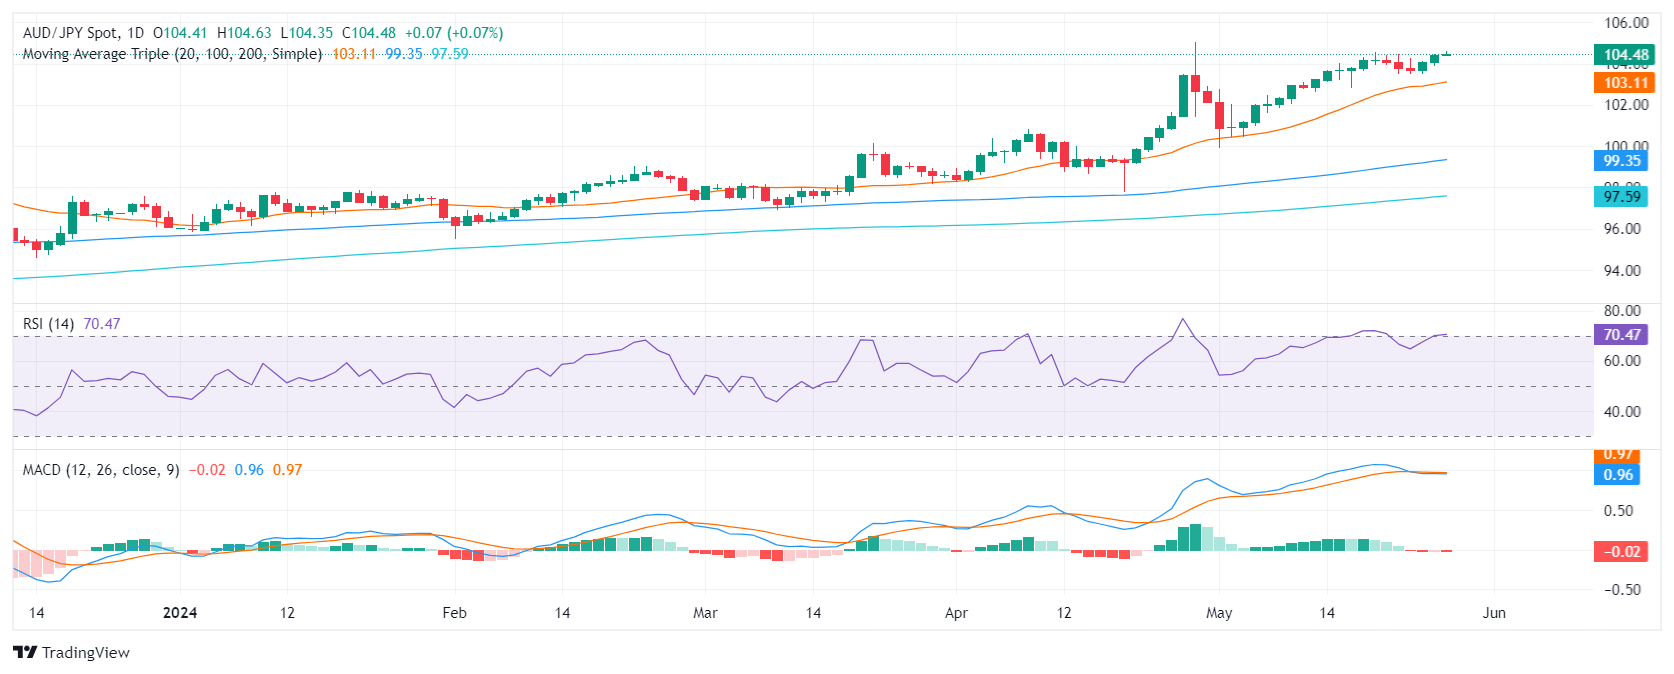
  • Daily chart indicators suggest a slowdown in buying traction with RSI positioned above 70 indicating overbought conditions.
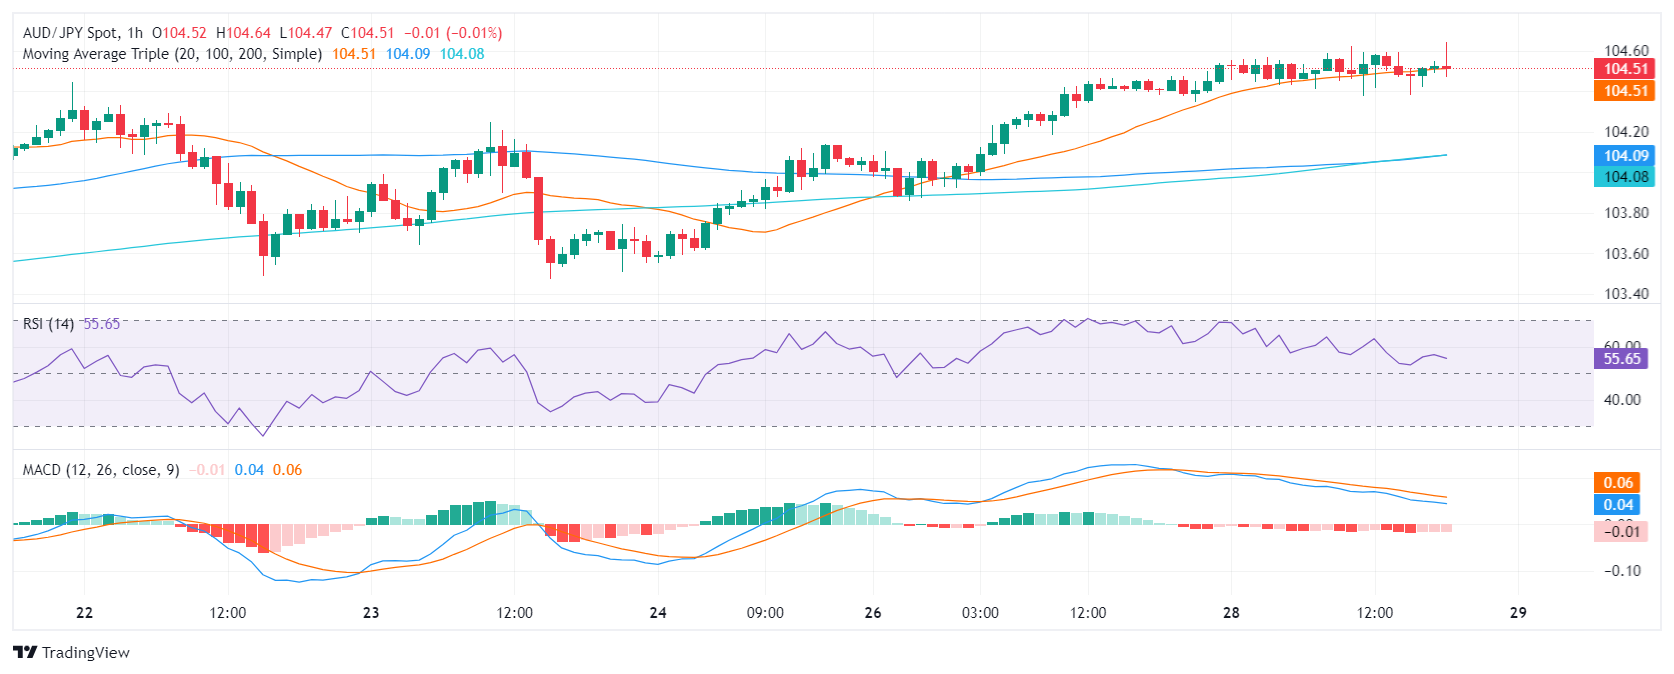
  • Hourly chart indicators weaken, implying the possibility of short-term losses in the upcoming Asian session.
  • The bulls might not have enough traction to retest the cycle highs above 105.00.

In Tuesday's session, the AUD/JPY pair continued to edge higher, securing some gains but at a seemingly slower pace, stabilizing around the 104.60 mark. Given the extended upward phase with 15 gains out of the last 19 sessions, buyers may be showing signs of fatigue. The market could be heading towards a short-term correction as indicators flash overbought signals.

On the daily chart, the RSI has inched above the 70 territory, an area typically considered overbought. This situation, along with the MACD producing red bars, suggests that while buyers still hold control, their grip is loosening.

AUD/JPY daily chart
The hourly chart portrays similar sentiments. The RSI is nearing 50 and displays a downward bias. Concurrently, the MACD prints rising red bars, hinting at a weakening bullish momentum in the near term.

AUD/JPY hourly chart
Zooming out for the big picture, the AUD/JPY continues to trade above all three key Simple Moving Average (SMA) benchmarks of 20, 100, and 200 days, affirming a bullish perspective. However, with the pair stabilizing around multi-year highs, and overt signs of buyer exhaustion, the possibility of a near-term correction is becoming increasingly apparent. The main resistance is the cycle high just above 105.00 while the 20-day SMA at 103.12 offers itself as a strong support.


AUD/JPY

Overview
Today last price 104.5
Today Daily Change 0.09
Today Daily Change % 0.09
Today daily open 104.41
 
Trends
Daily SMA20 103
Daily SMA50 101.03
Daily SMA100 99.27
Daily SMA200 97.54
 
Levels
Previous Daily High 104.46
Previous Daily Low 103.86
Previous Weekly High 104.56
Previous Weekly Low 103.48
Previous Monthly High 105.04
Previous Monthly Low 97.78
Daily Fibonacci 38.2% 104.23
Daily Fibonacci 61.8% 104.09
Daily Pivot Point S1 104.03
Daily Pivot Point S2 103.64
Daily Pivot Point S3 103.42
Daily Pivot Point R1 104.63
Daily Pivot Point R2 104.85
Daily Pivot Point R3 105.24


USD/JPY Price Analysis: Advances modestly and reclaims 157.00

The USD/JPY wavers around 157.00 as the Greenback remains steady in Tuesday’s session.
了解更多 Previous

GBP/JPY breaks into fresh multi-decade highs as Yen continues to soften

GBP/JPY drifted into a new 34-year high above 200.60 on Tuesday as Yen pairs continue to pare away JPY strength following suspected “Yenterventions” from the Bank of Japan (BoJ) and Japanese Minstry of Finance who overspent nine trillion Yen on miscellaneous financial operations and is broadly assumed to have intervened directly in global markets in an attempt to shore up the battered Yen.
了解更多 Next