Crude Oil extends gains, WTI breaks $80 as markets look to OPEC+
- Crude Oil markets extend rebound, WTI gains over 5% from bottom.
- Barrel traders look to OPEC+ to keep production down.
- US Crude Oil supplies continue to fluster energy markets.
West Texas Intermediate (WTI) US Crude Oil rose on Tuesday as energy markets look to production cuts from the Organization of the Petroleum Exporting Countries (OPEC), and its extended network of non-member partner countries OPEC+, to maintain production cuts in order to try and tamp down global Crude Oil production in the face of disappointing demand.
OPEC begins an online-only meeting on Sunday, June 2, where the Crude Oil alliance is broadly expected to maintain voluntary production caps of 2.2 million bpd that have been in place since the third quarter of 2023. Global Crude Oil demand failed to rebound through 2024 to a degree that energy markets had anticipated, and global production risks running far ahead of how much Crude Oil that global economies can absorb.
US production continues to threaten a widening overhang on demand, and investors will be looking to this week’s Crude Oil supplies and stocks barrel counts from the American Petroleum Institute (API) and the Energy Information Administration (EIA). API and EIA barrel counts both printed higher than expected last week, adding to a supply buildup that has persisted through most of 2024. API Weekly Crude Oil Stocks for the week ended May 24 are slated for late Wednesday, with EIA Crude Oil Stocks Change for the same period expected later Thursday.
Economic Indicator
API Weekly Crude Oil Stock
API’s Weekly Statistical Bulletin (WSB) has reported total U.S. and regional data relating to refinery operations and the production of the four major petroleum products: motor gasoline, kerosene jet fuel, distillate (by sulfur content), and residual fuel oil. These products represent more than 85% of total petroleum industry.
Read more.Next release: Wed May 29, 2024 20:30
Frequency: Weekly
Consensus: -
Previous: 2.48M
Source: American Petroleum Institute
Economic Indicator
EIA Crude Oil Stocks Change
The EIA Crude Oil stockpiles report is a weekly measure of the change in the number of barrels in stock of crude oil and its derivates, and it's released by the Energy Information Administration. This report tends to generate large price volatility, as oil prices impact on worldwide economies, affecting the most, commodity related currencies such as the Canadian dollar. Despite it has a limited impact among currencies, this report tends to affect the price of oil itself, and, therefore, had a more notorious impact on WTI crude futures.
Read more.Next release: Thu May 30, 2024 15:00
Frequency: Weekly
Consensus: -2M
Previous: 1.825M
WTI technical outlook
WTI US Crude Oil climbed over 5% from the last swing low into $76.00 per barrel, cracking $80.00 and climbing over $1.50 per barrel on Tuesday. WTI is testing into last week’s high bids and a near-term consolidation pattern is threatening to harden into the charts.
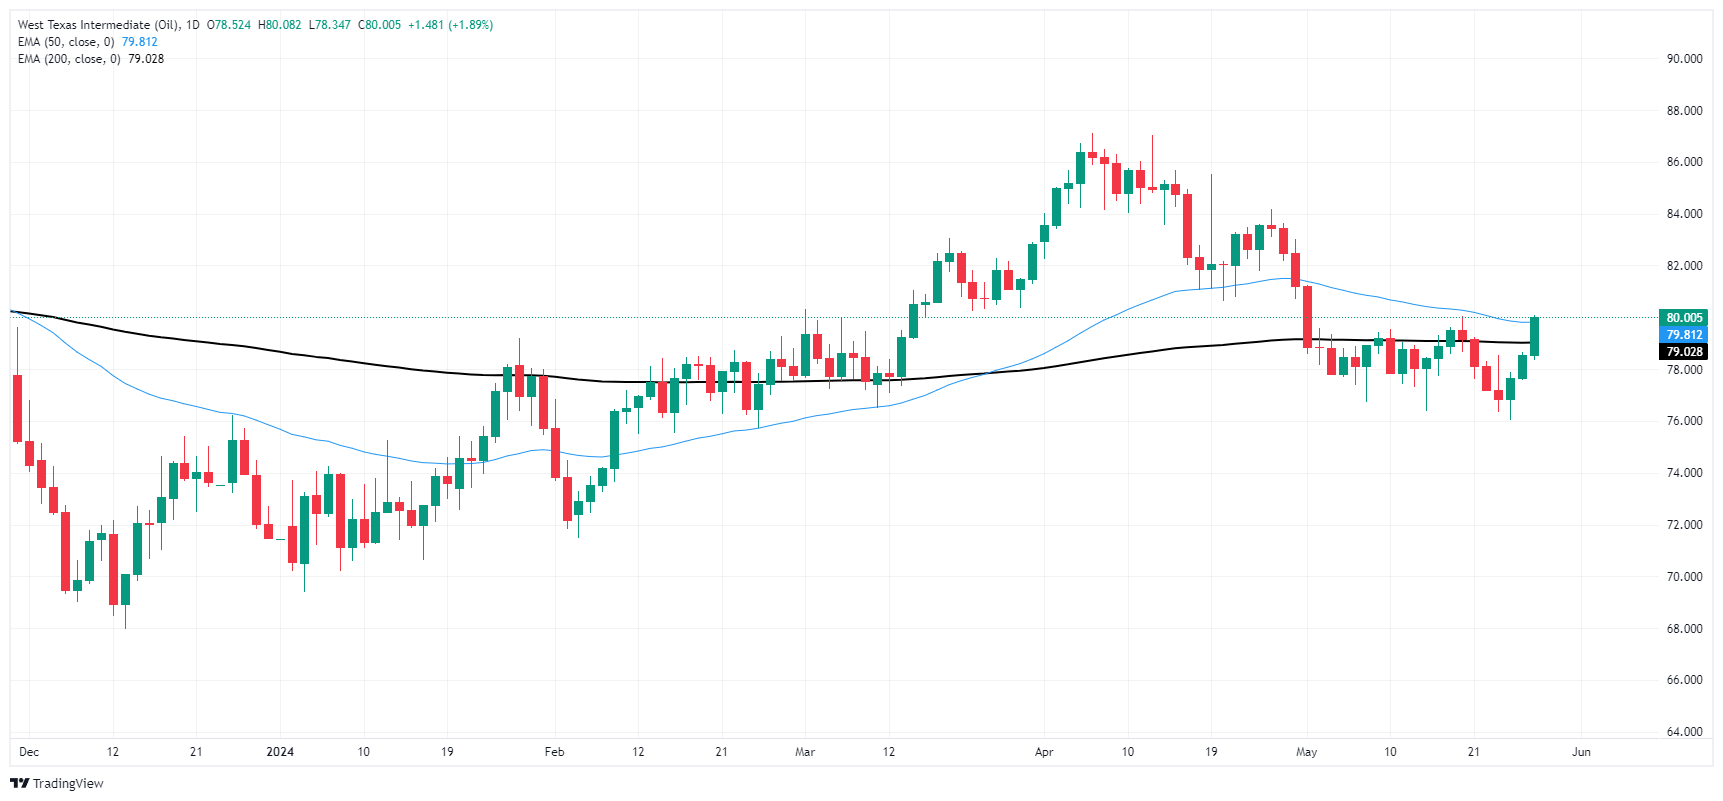
US Crude Oil is on pace to close in the green for a third straight trading day, and remains down from 2024’s peaks near $87.00. Despite recent downside, WTI remains up in 2024, climbing 12% from the year’s opening bids near $71.50.
WTI hourly chart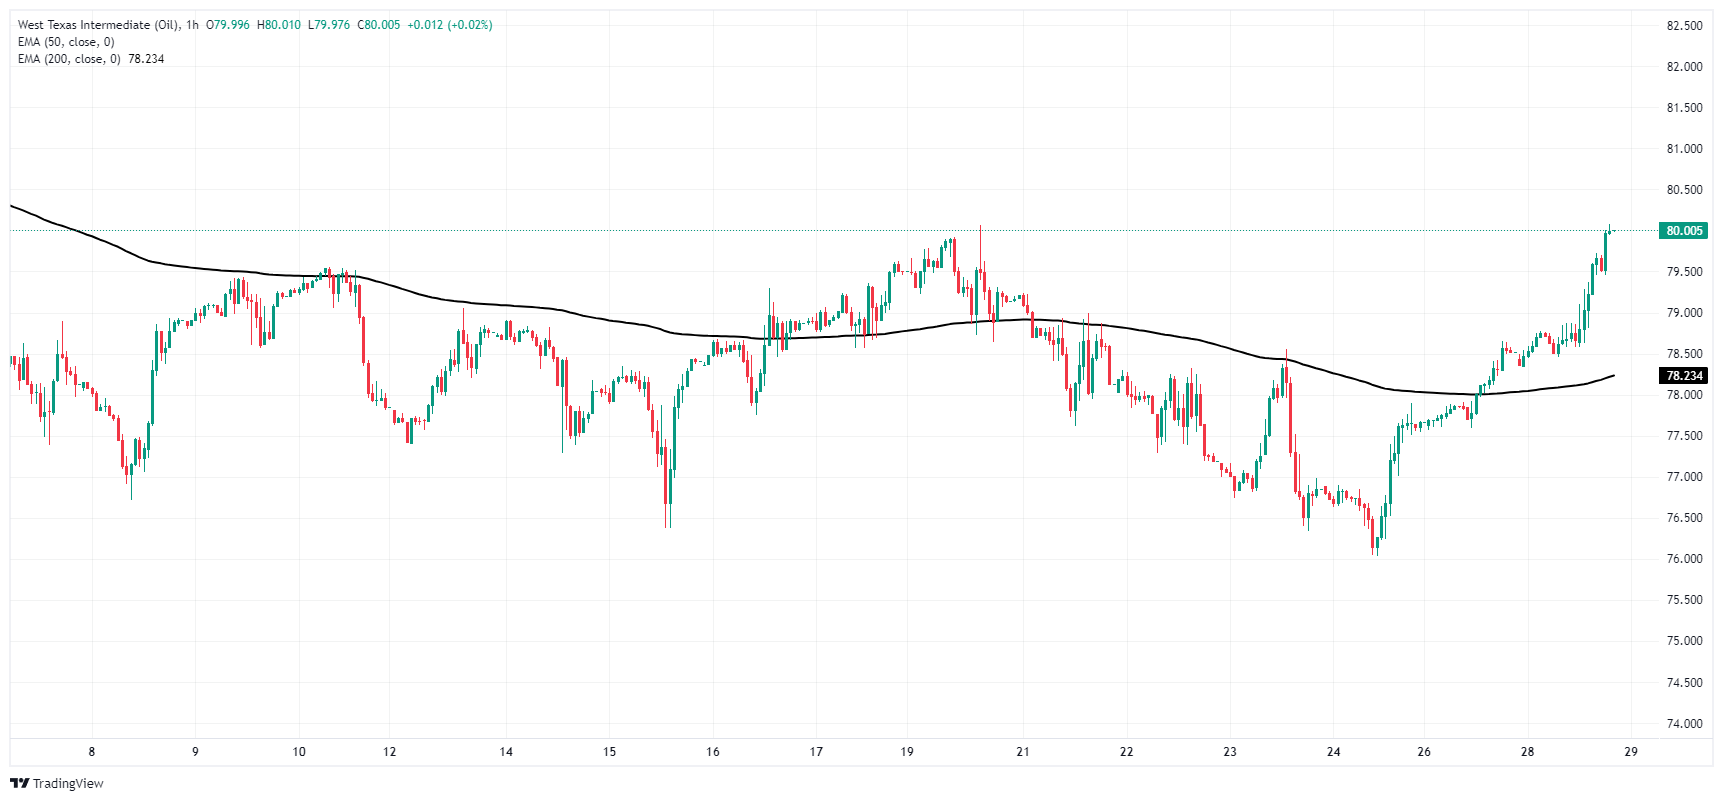
WTI daily chart