USD/CAD Price Analysis: Remains inside the woods in a thin trading-volume session
- USD/CAD juggles near Friday’s low around 1.3650 as trading volume is low due to holiday in US markets.
- Traders pare bets supporting Fed rate cuts in September.
- The BoC is widely anticipated to start reducing interest rates from June.
The USD/CAD pair trades in a narrow range near Friday’s low around 1.3650 in Monday’s European session. The Loonie asset is on the backfoot as the US Dollar faces selling pressure in a thin trading volume session as the United States (US) markets are closed on account of Memorial Day.
The US Dollar could bounce back as investors worry that the Federal Reserve (Fed) will not return to policy normalization before the last quarter of this year. The CME FedWatch tool shows that probability for interest rates remaining steady at their current levels after the September meeting has increased to 51% from 38% recorded last week.
Also, Fed policymakers continue to maintain a hawkish guidance on interest rates as they believe that one-time decline in the inflation data as recorded for April is insufficient to get confidence that the progress in the disinflation process has resumed.
Meanwhile, the Canadian Dollar could come under pressure as investors expect that the Bank of Canada (BoC) will start reducing interest rates from the June meeting. Canada’s weak Retail Sales and consistently declining price pressures have prompted expectations for BoC rate-cuts in June.
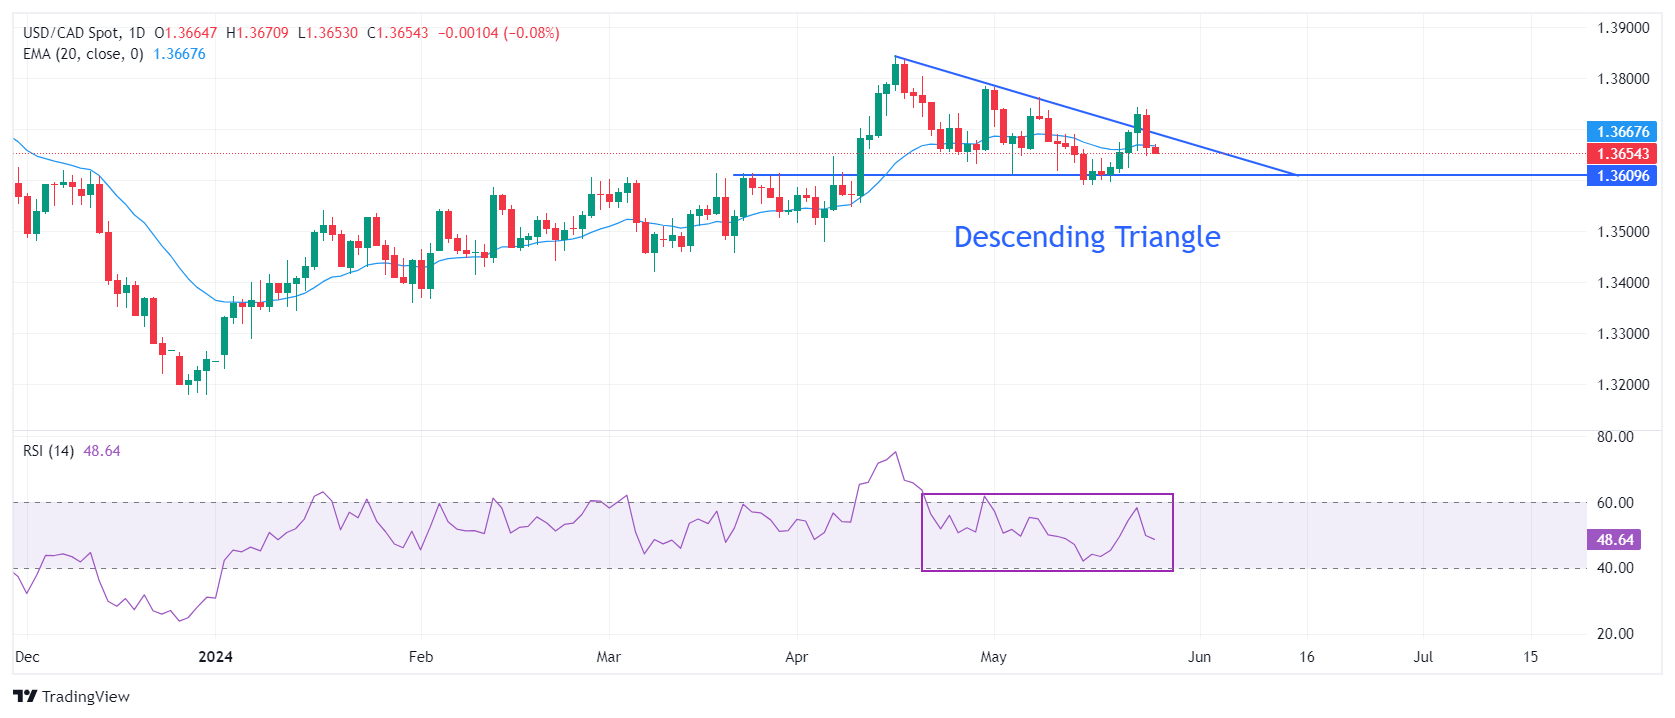
USD/CAD trades in a Descending Triangle chart formation on a daily timeframe, which exhibits a sharp volatility contraction. The downward-sloping border of the above-mentioned chart pattern is plotted from April 16 high at 1.3846 while the horizontal support is marked from March 25 high near 1.3570.
The Loonie asset remains sticky to the 20-day Exponential Moving Average (EMA) near 1.3670, suggesting a sideways trend.
The 14-period Relative Strength Index (RSI) oscillates in the 40.00-60.00 range, indicating indecisiveness among market participants.
Fresh buying opportunity would emerge if the asset breaks above April 30 high at 1.3785. This would drive the asset towards April 17 high at 1.3838, followed by the round-level resistance of 1.3900.
In an alternate scenario, a breakdown below May 3 low around 1.3600 will expose the asset to the April 9 low around 1.3547 and the psychological support of 1.3500.
USD/CAD daily chart


