确认您不是来自美国或菲律宾

在此声明,本人明确声明并确认:
  • 我不是美国公民或居民
  • 我不是菲律宾居民
  • 本人没有直接或间接拥有美国居民10%以上的股份/投票权/权益,和/或没有通过其他方式控制美国公民或居民。
  • 本人没有直接或间接的美国公民或居民10%以上的股份/投票权/权益的所有权,和/或受美国公民或居民其他任何方式行使的控制。
  • 根据FATCA 1504(a)对附属关系的定义,本人与美国公民或居民没有任何附属关系。
  • 我知道做出虚假声明所需付的责任。
就本声明而言,所有美国附属国家和地区均等同于美国的主要领土。本人承诺保护Octa Markets Incorporated及其董事和高级职员免受因违反本声明而产生或与之相关的任何索赔。
我们致力于保护您的隐私和您个人信息的安全。我们只收集电子邮件,以提供有关我们产品和服务的特别优惠和重要信息。通过提交您的电子邮件地址,您同意接收我们的此类信件。如果您想取消订阅或有任何问题或疑虑,请联系我们的客户支持。
Octa trading broker
开通交易账户
Back

NZD/USD Price Analysis: Bulls maintain momentum, eyes on bullish crossover

  • The daily indicators remain in positive territory but somewhat flattened .
  • The hourly charts reveal a temporary dip in the RSI and a MACD flattening, signaling a possible short-term consolidation.
  • Pending bullish crossover between the 200 and 100-day SMA at 0.6040 could bolster the bullish momentum in future sessions.

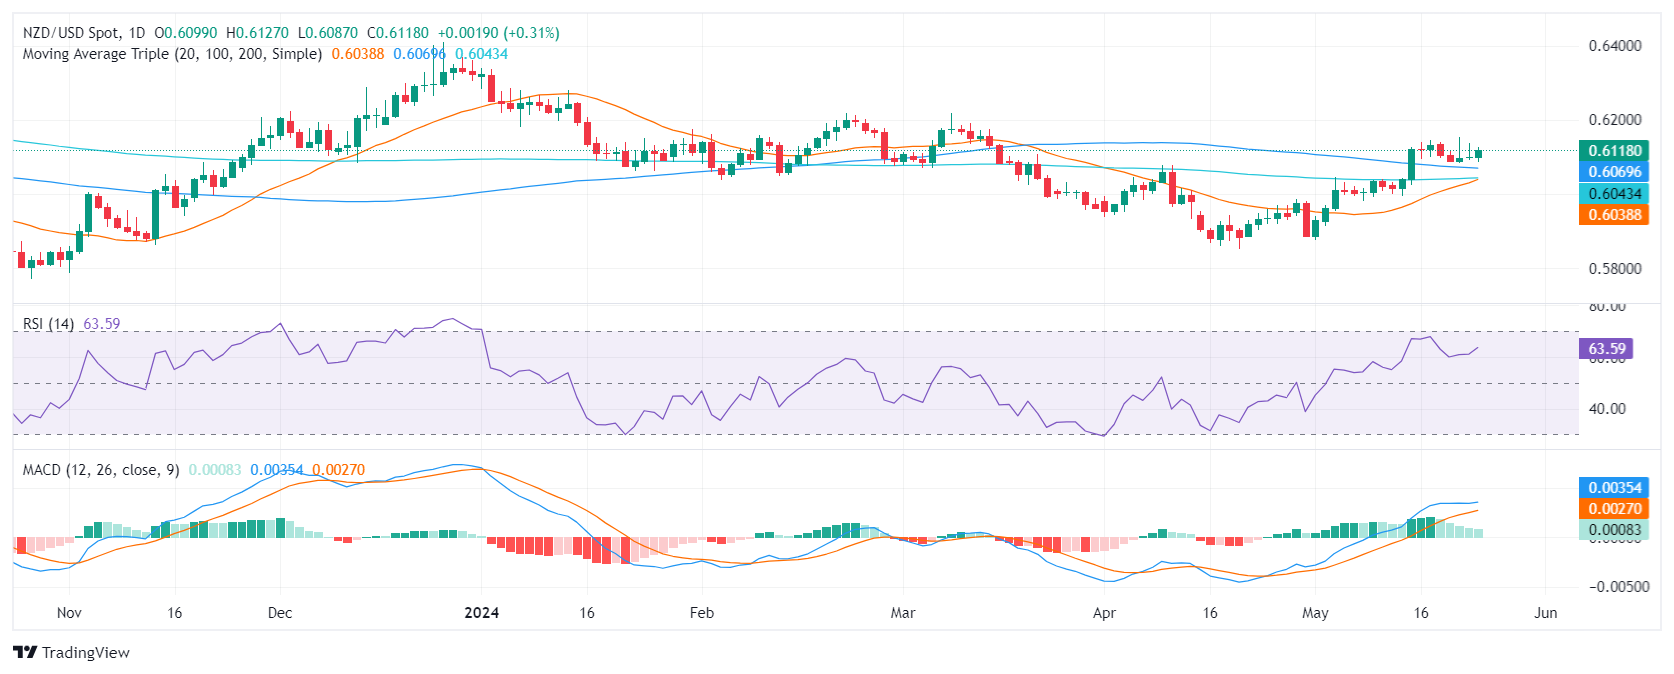
During Friday's session, NZD/USD rose towards the 0.6125 level. The positive trajectory of the pair continues to convey a strong buyer influence in the market. However, echoes of consolidation may suggest a breather following the recent surge which pushed the pair above the 100 and 200-day Simple Moving Averages (SMA).

Examining the daily chart of the NZD/ pair, it is apparent that the Relative Strength Index (RSI) reveals a robust positive trend. After a close approach to overbought conditions at 69, the RSI receded to a still positive level of 63. In line with that, the Moving Average Convergence Divergence (MACD) prints flat green bars which may suggest a flattening momentum.

NZD/USD daily chart

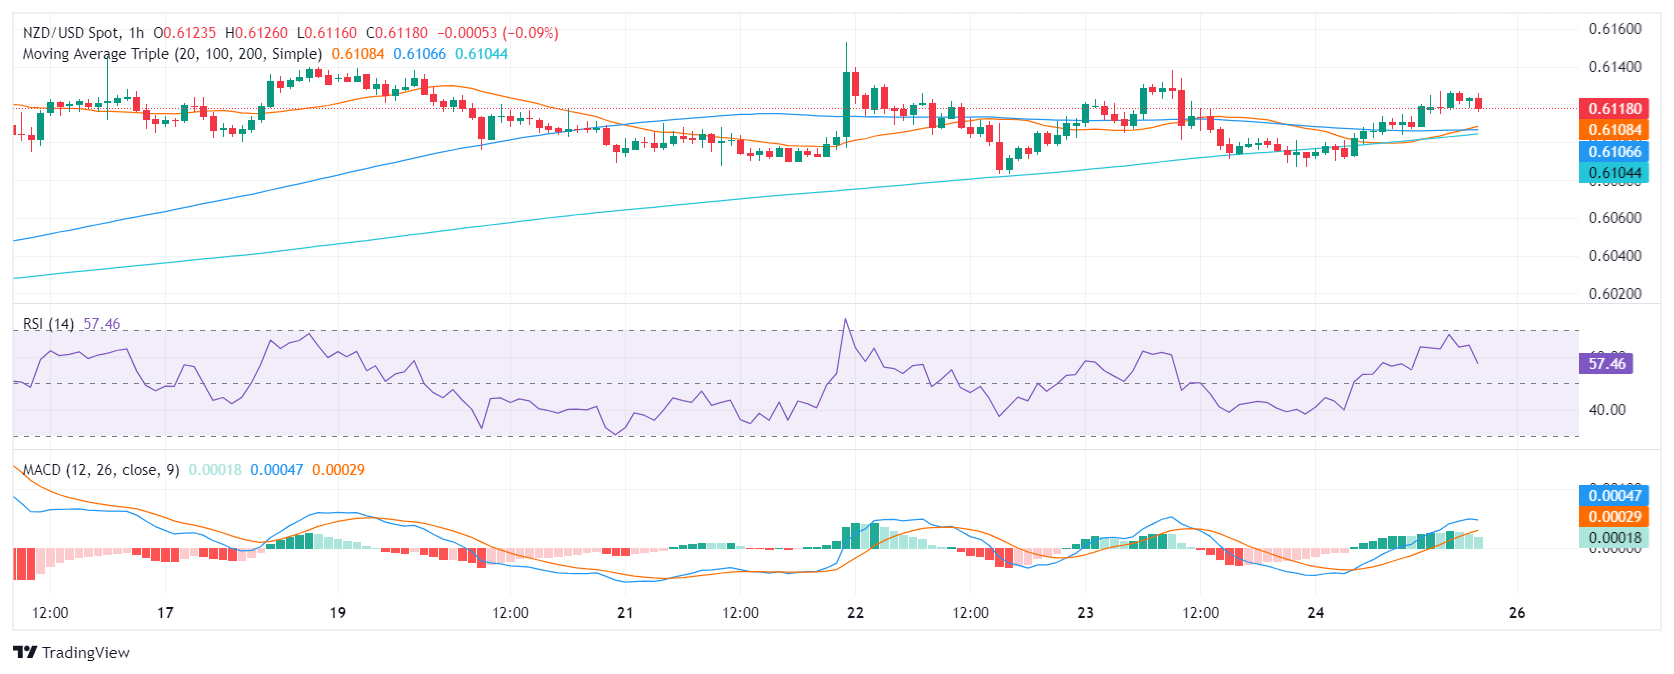
Transitioning to the hourly chart, there is a discernible decreasing trend in the RSI readings, with figures retreating from 64 to 57 throughout Friday’s session. The MACD histogram aligns with this pattern, with flat green bars that signal reduced upward momentum.

NZD/USD hourly chart

From a broader perspective, the position of NZD/USD suggests a strong bullish trend. Trading above the Simple Moving Averages (SMA) of 20, 100, and 200-day, the pair displays upward momentum both on short-term and long-term scales.

Incorporating both the daily and hourly RSI trends, along with MACD and SMA positioning, the conclusion is drawn that the NZD/USD may need some respite after its recent surge. Despite this, the market structure maintains its bullish tone.


NZD/USD

Overview
Today last price 0.6118
Today Daily Change 0.0019
Today Daily Change % 0.31
Today daily open 0.6099
 
Trends
Daily SMA20 0.603
Daily SMA50 0.6003
Daily SMA100 0.6071
Daily SMA200 0.6042
 
Levels
Previous Daily High 0.6138
Previous Daily Low 0.6091
Previous Weekly High 0.6146
Previous Weekly Low 0.5995
Previous Monthly High 0.6079
Previous Monthly Low 0.5851
Daily Fibonacci 38.2% 0.612
Daily Fibonacci 61.8% 0.6109
Daily Pivot Point S1 0.6081
Daily Pivot Point S2 0.6062
Daily Pivot Point S3 0.6033
Daily Pivot Point R1 0.6128
Daily Pivot Point R2 0.6157
Daily Pivot Point R3 0.6175


USD/JPY steady on Friday after another week of gains

USD/JPY churned on Friday, wrapping up close to where it started the day, just below the 157.00 handle, as investors looked to recover balance after a tense week.
了解更多 Previous

AUD/USD gathers strength above 0.6630 on weaker US Dollar

The AUD/USD pair edges higher to 0.6632 during the early Asian session on Monday.
了解更多 Next