确认您不是来自美国或菲律宾

在此声明,本人明确声明并确认:
  • 我不是美国公民或居民
  • 我不是菲律宾居民
  • 本人没有直接或间接拥有美国居民10%以上的股份/投票权/权益,和/或没有通过其他方式控制美国公民或居民。
  • 本人没有直接或间接的美国公民或居民10%以上的股份/投票权/权益的所有权,和/或受美国公民或居民其他任何方式行使的控制。
  • 根据FATCA 1504(a)对附属关系的定义,本人与美国公民或居民没有任何附属关系。
  • 我知道做出虚假声明所需付的责任。
就本声明而言,所有美国附属国家和地区均等同于美国的主要领土。本人承诺保护Octa Markets Incorporated及其董事和高级职员免受因违反本声明而产生或与之相关的任何索赔。
我们致力于保护您的隐私和您个人信息的安全。我们只收集电子邮件,以提供有关我们产品和服务的特别优惠和重要信息。通过提交您的电子邮件地址,您同意接收我们的此类信件。如果您想取消订阅或有任何问题或疑虑,请联系我们的客户支持。
Octa trading broker
开通交易账户
Back

NZD/USD Price Analysis: Bullish sentiment maintains despite softening momentum

  • Despite softening positive momentum indicated by the daily MACD, the overall trend still favors the buyers.
  • Hourly chart shows fairly neutral RSI but negative momentum in MACD, signaling possible short-term fluctuations.
  • Regardless of potential shifts suggested by hourly indicators, the overall bullish bias based on daily SMAs is intact.
  • Signs of weakening buying momentum in NZD/USD implies potential retests of key SMAs, dictating investor alertness.

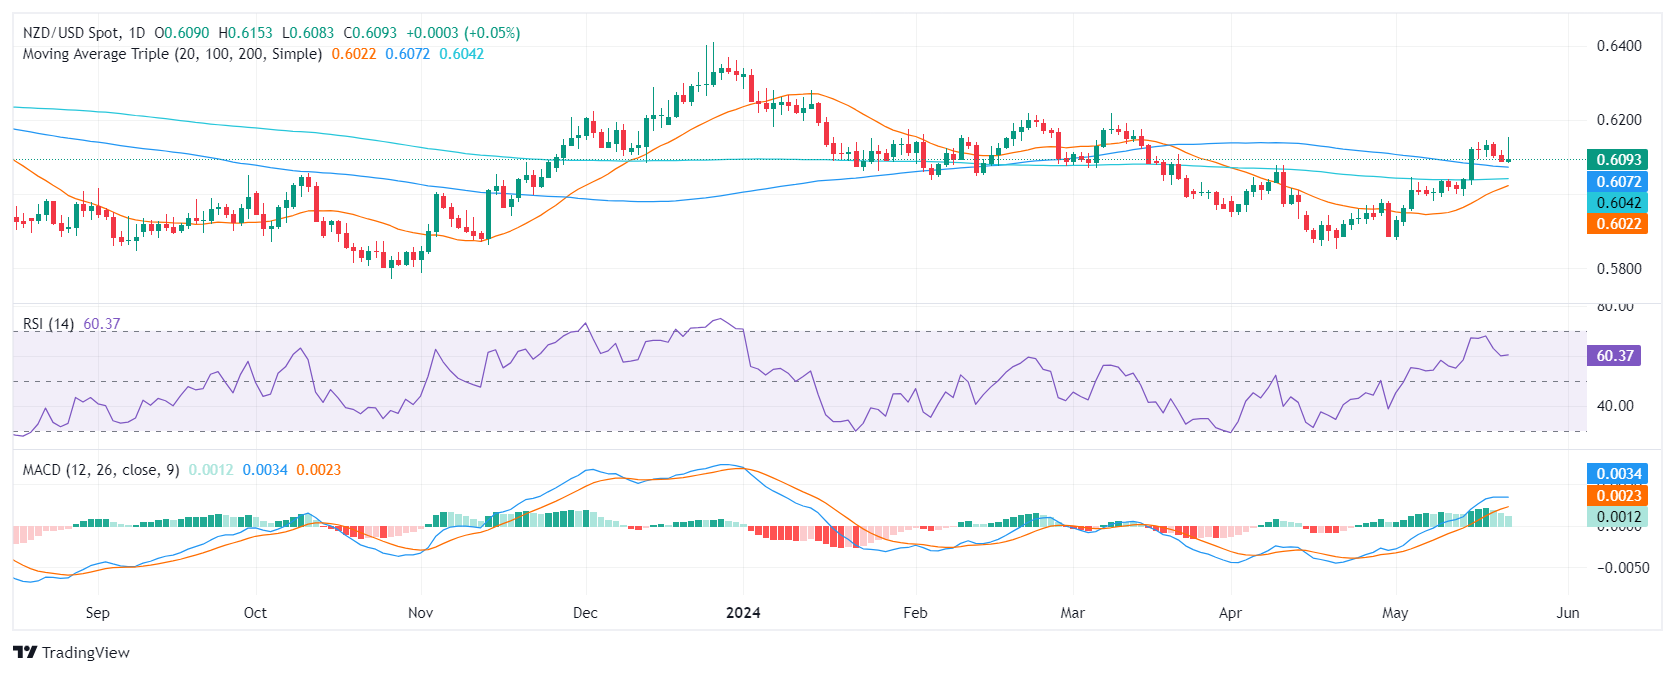
On Wednesday's session, the NZD/USD showed diminishing buying traction and fell just below 0.6100. However, the short-term outlook will be positive if the pair maintains its position over new reference points set by 100 and 200-day Simple Moving Averages (SMAs). If lost, the bears might step in aggressively.

Examining the daily chart, the Relative Strength Index (RSI) exhibits a positive but flattening trend, with its most recent reading of 60. Simultaneously, the Moving Average Convergence Divergence (MACD) displays decreasing green bars indicating a slight softening of positive momentum.

NZD/USD daily chart

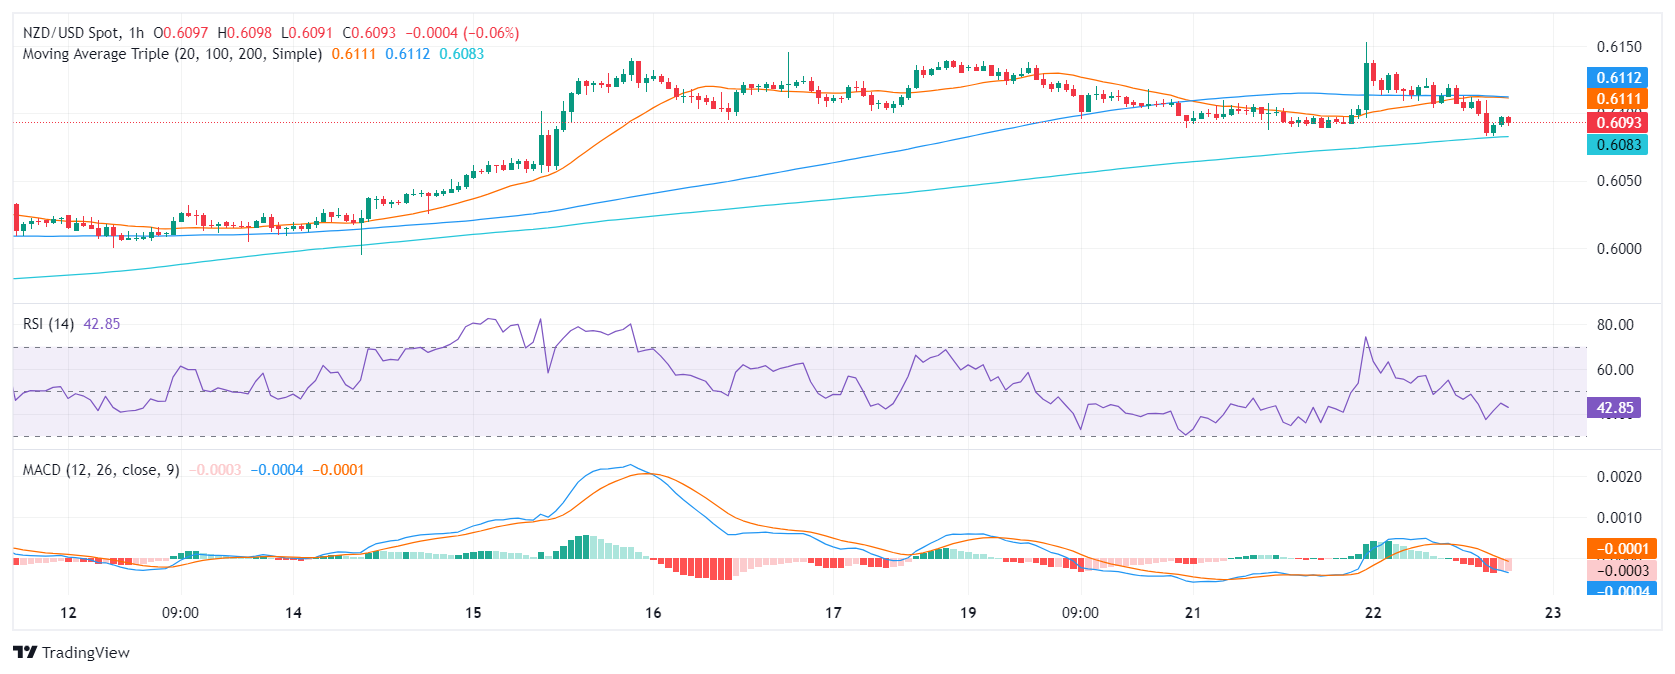
Focusing on the hourly view, the RSI has moderately adjusted with the latest reading of 41, reflecting a fairly neutral direction. Notably, the MACD histogram has produced consistently flat red bars, signaling negative momentum on an intraday basis.

NZD/USD hourly chart

In conclusion, investors seem to be taking profits and, should the pair hold above the recently-conquered 100 and 200-day Simple Moving Averages (SMAs), any downward movement should not necessarily be considered a selling signal. However, buying traction appears to be waning, and the pair is set for a retest of the mentioned SMAs.


NZD/USD

Overview
Today last price 0.6093
Today Daily Change 0.0003
Today Daily Change % 0.05
Today daily open 0.609
 
Trends
Daily SMA20 0.6014
Daily SMA50 0.6004
Daily SMA100 0.6074
Daily SMA200 0.6041
 
Levels
Previous Daily High 0.6118
Previous Daily Low 0.6087
Previous Weekly High 0.6146
Previous Weekly Low 0.5995
Previous Monthly High 0.6079
Previous Monthly Low 0.5851
Daily Fibonacci 38.2% 0.6099
Daily Fibonacci 61.8% 0.6106
Daily Pivot Point S1 0.6079
Daily Pivot Point S2 0.6068
Daily Pivot Point S3 0.6049
Daily Pivot Point R1 0.6109
Daily Pivot Point R2 0.6129
Daily Pivot Point R3 0.614


Silver Price Analysis: XAG/USD plunges below $31.00 amid Fed’s hawkish minutes

Silver price tumbled more than 3.50% during the North American session after the Federal Reserve revealed “hawkish tilted” minutes that showed some officials would like to raise rates if inflation warranted it.
了解更多 Previous

Crude Oil recedes further, WTI falls below $78 on rising supplies and cautious FOMC

West Texas Intermediate (WTI) US Crude Oil declined for a third straight day on Wednesday, falling below $78.00 per barrel once again after US Crude Oil barrel counts rose week-on-week after a previous decline.
了解更多 Next