确认您不是来自美国或菲律宾

在此声明,本人明确声明并确认:
  • 我不是美国公民或居民
  • 我不是菲律宾居民
  • 本人没有直接或间接拥有美国居民10%以上的股份/投票权/权益,和/或没有通过其他方式控制美国公民或居民。
  • 本人没有直接或间接的美国公民或居民10%以上的股份/投票权/权益的所有权,和/或受美国公民或居民其他任何方式行使的控制。
  • 根据FATCA 1504(a)对附属关系的定义,本人与美国公民或居民没有任何附属关系。
  • 我知道做出虚假声明所需付的责任。
就本声明而言,所有美国附属国家和地区均等同于美国的主要领土。本人承诺保护Octa Markets Incorporated及其董事和高级职员免受因违反本声明而产生或与之相关的任何索赔。
我们致力于保护您的隐私和您个人信息的安全。我们只收集电子邮件,以提供有关我们产品和服务的特别优惠和重要信息。通过提交您的电子邮件地址,您同意接收我们的此类信件。如果您想取消订阅或有任何问题或疑虑,请联系我们的客户支持。
Octa trading broker
开通交易账户
Back

GBP/USD Price Analysis: Stays bullish despite retreating from two-month highs

  • GBP/USD clings to earlier gains after UK CPI data.
  • Immediate resistance at 1.2800 remains elusive for buyers.
  • Support at 1.2700; once cleared, GBP/USD could dive toward a confluence of technical indicators around 1.2634.

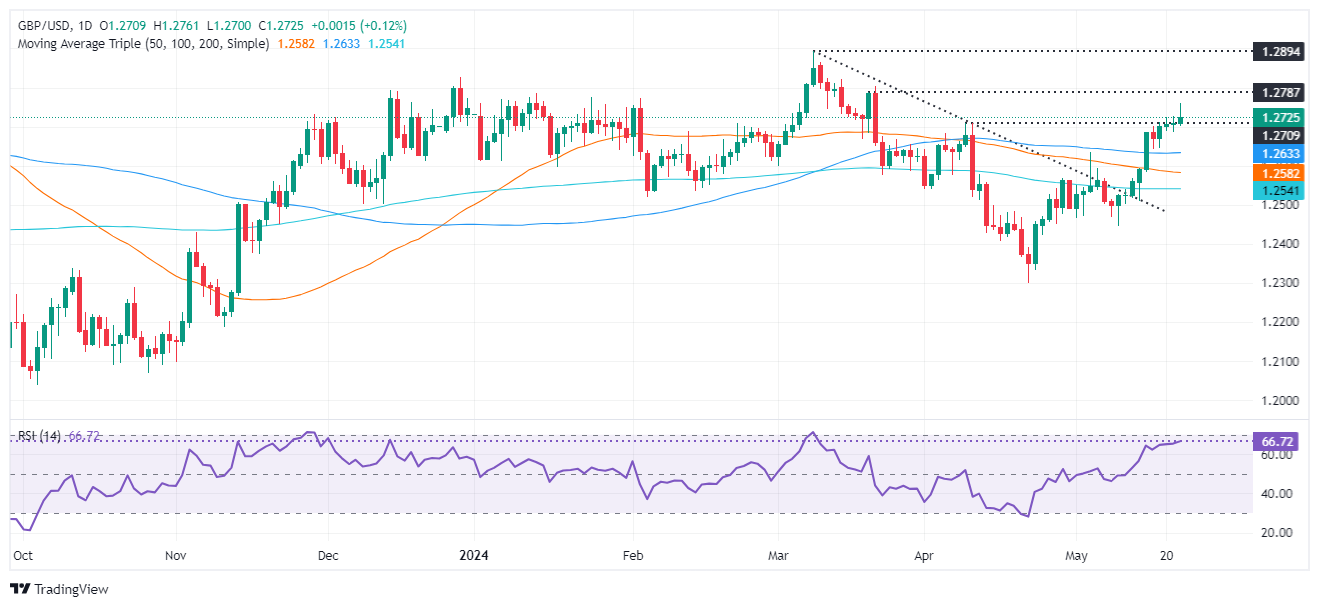
The Pound Sterling holds to earlier gains versus the Greenback following a hotter-than-expected inflation report in the UK, yet the pair pulls back from a two-month high as the CPI approaches the Bank of England’s goal. The GBP/USD trades at 1.2739, up 0.24%.

GBP/USD Price Analysis: Technical outlook

The pair remains neutral to upward bias despite exchanging hands below the 1.2761 daily high of the session. Momentum backs buyers, as shown by the Relative Strength Index (RSI), as they are leaning onto the 1.2700 psychological figure as the first line of defense.

To extend their gains, buyers must reclaim the March 21 high of 1.2803. Further gains lie overhead, with the year-to-date (YTD) high at 1.2893, 1.2900, and the psychological 1.3000 mark.

Conversely, a retracement would emerge once the GBP/USD tumbles below 1.2700, exposing the confluence of May’s 3 high and the 100-day moving average (DMA) at 1.2634, followed by the 50-DMA at 1.2581.

GBP/USD Price Action – Daily Chart

GBP/USD

Overview
Today last price 1.2728
Today Daily Change 0.0019
Today Daily Change % 0.15
Today daily open 1.2709
 
Trends
Daily SMA20 1.2569
Daily SMA50 1.2584
Daily SMA100 1.2633
Daily SMA200 1.2541
 
Levels
Previous Daily High 1.2727
Previous Daily Low 1.2686
Previous Weekly High 1.2712
Previous Weekly Low 1.2509
Previous Monthly High 1.2709
Previous Monthly Low 1.23
Daily Fibonacci 38.2% 1.2711
Daily Fibonacci 61.8% 1.2702
Daily Pivot Point S1 1.2688
Daily Pivot Point S2 1.2667
Daily Pivot Point S3 1.2647
Daily Pivot Point R1 1.2729
Daily Pivot Point R2 1.2748
Daily Pivot Point R3 1.277


AUD/USD Price Analysis: Posts fresh five-day low near 0.6640

The AUD/USD pair slumps to 0.6640 as the US Dollar exhibits firm footing in Wednesday’s New York session ahead of the release of the Federal Open Market Committee (FOMC) minutes of May’s policy meeting, which will be published later in the day.
了解更多 Previous

Russia Producer Price Index (YoY) dipped from previous 19.1% to 18.4% in April

Russia Producer Price Index (YoY) dipped from previous 19.1% to 18.4% in April
了解更多 Next