确认您不是来自美国或菲律宾

在此声明,本人明确声明并确认:
  • 我不是美国公民或居民
  • 我不是菲律宾居民
  • 本人没有直接或间接拥有美国居民10%以上的股份/投票权/权益,和/或没有通过其他方式控制美国公民或居民。
  • 本人没有直接或间接的美国公民或居民10%以上的股份/投票权/权益的所有权,和/或受美国公民或居民其他任何方式行使的控制。
  • 根据FATCA 1504(a)对附属关系的定义,本人与美国公民或居民没有任何附属关系。
  • 我知道做出虚假声明所需付的责任。
就本声明而言,所有美国附属国家和地区均等同于美国的主要领土。本人承诺保护Octa Markets Incorporated及其董事和高级职员免受因违反本声明而产生或与之相关的任何索赔。
我们致力于保护您的隐私和您个人信息的安全。我们只收集电子邮件,以提供有关我们产品和服务的特别优惠和重要信息。通过提交您的电子邮件地址,您同意接收我们的此类信件。如果您想取消订阅或有任何问题或疑虑,请联系我们的客户支持。
Octa trading broker
开通交易账户
Back

Silver Price Analysis: XAG/USD edges up yet remains below $32.00

  • Silver is up 0.47%, just below Monday's eight-year high of $32.51.
  • Strong upward momentum continues; RSI suggests further gains possible despite overbought conditions.
  • Resistance levels at $32.51, $33.00, and October 2012 high of $35.40.
  • Supports at May 20 low of $30.95, April 12 high of $29.79, and $28.00 psychological level.

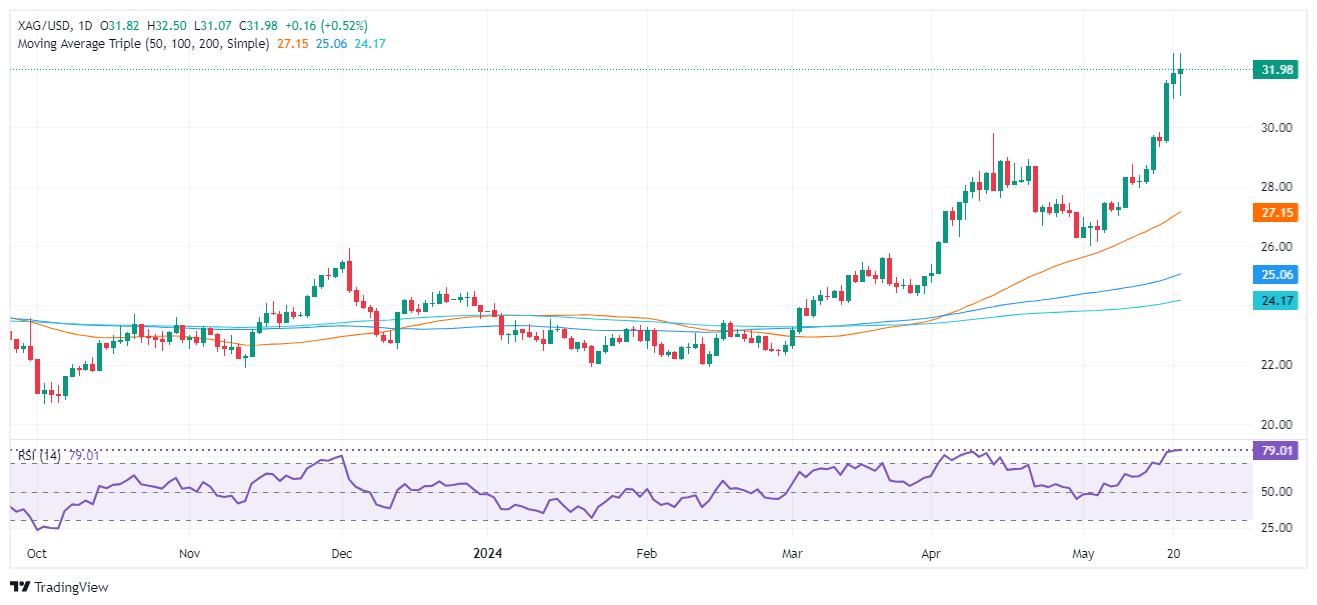
Silver's price advanced 0.47% on Tuesday but remains trading below a significant eight-year high reached on Monday at $32.51. At the time of writing, the XAG/USD is at $31.96 after hitting a daily low of $31.80.

XAG/USD Price Analysis: Technical outlook

The grey metal remains upward biased even though it failed to crack the year-to-date (YTD) high of $32.51. Although the Relative Strength Index (RSI) is overbought, momentum is on the side of the buyers. Due to the uptrend's strength and speed, RSI remains shy of reaching overbought levels under strong trending conditions. In a strong uptrend, the RSI is considered overbought at 80.00.

With that said, if XAG/USD clears $32.51, further upside is seen as Silver’s next resistance emerges at $33.00. A breach of the latter could expose October’s 2012 high of $35.40.

Conversely, if Silver drops below the May 20 daily low of $30.95, further losses lie ahead. The next demand zone would be the April 12 high of $29.79, followed by the psychological figure of $28.00.

XAG/USD Price Action – Daily Chart

XAG/USD

Overview
Today last price 31.98
Today Daily Change 0.16
Today Daily Change % 0.50
Today daily open 31.82
 
Trends
Daily SMA20 28.02
Daily SMA50 27
Daily SMA100 24.97
Daily SMA200 24.13
 
Levels
Previous Daily High 32.51
Previous Daily Low 30.95
Previous Weekly High 31.6
Previous Weekly Low 27.97
Previous Monthly High 29.8
Previous Monthly Low 24.75
Daily Fibonacci 38.2% 31.92
Daily Fibonacci 61.8% 31.55
Daily Pivot Point S1 31.01
Daily Pivot Point S2 30.19
Daily Pivot Point S3 29.44
Daily Pivot Point R1 32.57
Daily Pivot Point R2 33.33
Daily Pivot Point R3 34.14


United States API Weekly Crude Oil Stock meets expectations (-3.1M) in May 17

United States API Weekly Crude Oil Stock meets expectations (-3.1M) in May 17
了解更多 Previous

EUR/USD flattens out near 1.0850 as data looms

EuR/USD stuck closely to familiar levels on a sedate Tuesday market session.
了解更多 Next