提供最佳价差和条件
 了解更多
了解更多

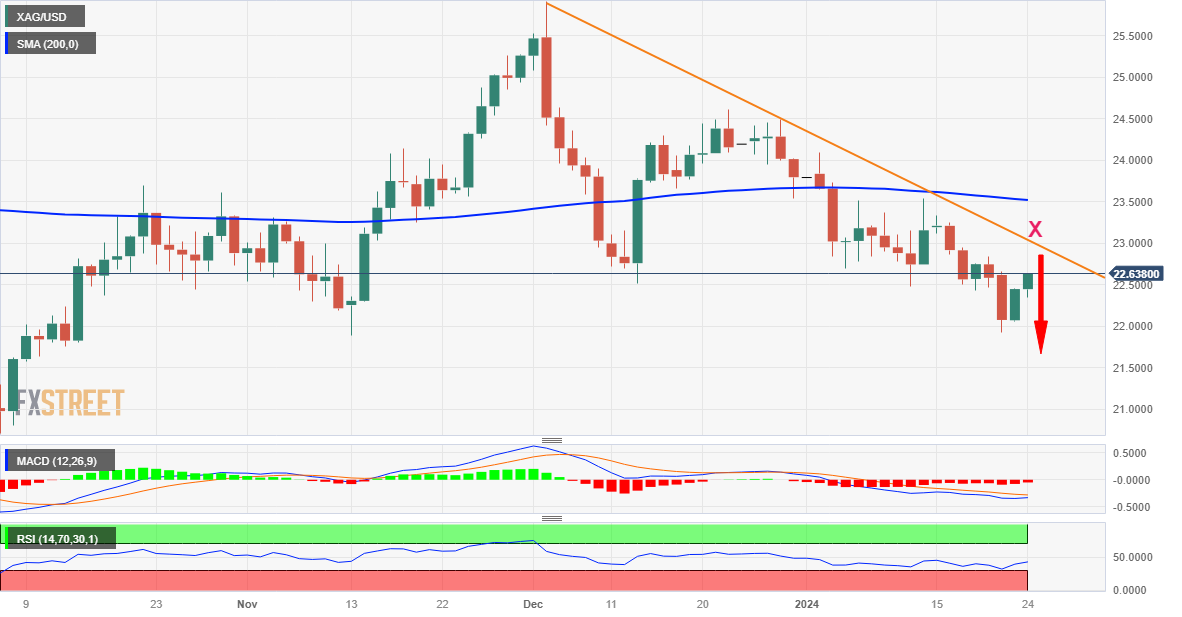
Silver (XAG/USD) gains positive traction for the second straight day on Wednesday and recovers further from its lowest level since November 13, around the $21.95-$21.90 area touched earlier this week. The white metal builds on the intraday move-up through the first half of the European session and climbs to the top end of its weekly range, around the $22.60-$22.65 region in the last hour.
From a technical perspective, any subsequent strength beyond the $22.75 zone is more likely to confront stiff resistance near the $23.00 round-figure mark. The said handle now coincides with a downward sloping trend-line extending from the December swing high, which if cleared decisively might trigger a short-covering rally. The XAG/USD might then accelerate the momentum beyond an intermediate hurdle near the $23.25-$23.30 area and aim to retest the very important 200-day Simple Moving Average (SMA), currently around mid-$23.00s.
The latter should act as a key pivotal point and a sustained strength beyond will suggest that the XAG/USD has formed a near-term bottom and pave the way for a further near-term appreciating move. The white metal could then reclaim the $24.00 mark and extend the positive move further towards the next relevant hurdle near the $24.40-$24.50 region. That said, negative oscillators on the daily chart warrant some caution for aggressive bulls.
On the flip side, the daily swing low, around the $22.35 zone, now seems to protect the immediate downside ahead of over a two-month low, around the $21.95-$21.90 region touched on Monday. Some follow-through selling will be seen as a fresh trigger for bearish traders and drag the XAG/USD to the $21.40-$21.35 support. The downward trajectory could extend further towards the $21.00 round figure en route to the October monthly swing low, around the $20.70-$20.65 region.