

Silver Price Analysis: XAG/USD moves away from over two-month low, not out of the woods yet
- Silver stages a goodish recovery from over a two-month low touched on Monday.
- The setup favours bears and supports prospects for the emergence of fresh selling.
- A sustained strength beyond the $23.00 mark is needed to negate the negative bias.
Silver (XAG/USD) attracts some buyers on Tuesday and for now, seems to have snapped a two-day losing streak to sub-$22.00 levels, or its lowest level since November 13 touched the previous day. The white metal sticks to its intraday gains through the first half of the European session and currently trades around the $22.30-$22.35 region, up over 1% for the day.
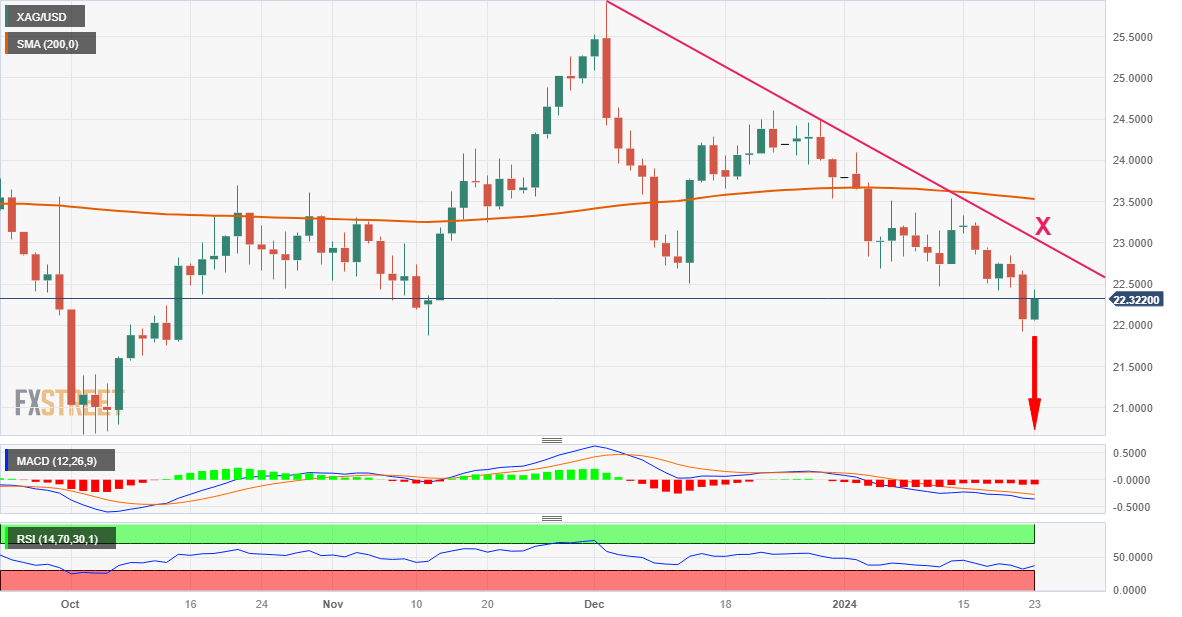
From a technical perspective, the recent repeated failures near the 200-day Simple Moving Average (SMA) resistance, which coincided with a downward sloping trend-line extending from the December swing high, favours bearish traders. Moreover, oscillators on the daily chart are holding deep in the negative territory and are still far from being in the oversold zone. This, in turn, suggests that the path of least resistance for the XAG/USD is to the downside.
Hence, any subsequent move up might still be seen as a selling opportunity and runs the risk of fizzling out rather quickly near the $22.70-$22.75 region. This is followed by the $23.00 round-figure mark, which should now act as a pivotal point. A sustained strength beyond the latter might trigger a short-covering rally and lift the XAG/USD beyond the $23.20-$23.25 intermediate hurdle, towards retesting the 200-day SMA barrier, currently pegged near mid-$23.00s.
Some follow-through buying will suggest that the white metal has formed a near-term bottom and shift the bias in favour of bullish traders. The subsequent move up might then allow the XAG/USD to reclaim the $24.00 round figure and climb further towards the next relevant resistance around the $24.40-$24.50 region.
On the flip side, bearish traders need to wait for acceptance below the $22.00 mark. The XAG/USD might then turn vulnerable to test the $21.40-$21.35 intermediate support before eventually dropping to the $21.00 round figure. The downward trajectory could extend further towards challenging the October monthly swing low, around the $20.70-$20.65 region.
Silver daily chart
Technical levels to watch