提供最佳价差和条件
 了解更多
了解更多

The GBP/USD is cycling in near-term congestion as thin post-holiday markets get set to wrap up the last day of trading in 2023, testing back into intraday median prices just above the 1.2700 handle.
The UK’s Nationwide Housing Prices slipped back further than expected in the annualized figure, printing at -1.8% for the year ending December versus the forecast -1.4%. Markets were expecting a healthier rebound from the previous period’s -2.0% print. Declining UK economic figures are capping off the Pound Sterling (GBP), which is largely catching support from a broad-market sell-off in the US Dollar (USD) as markets bet on faster and deeper rate cuts from the Federal Reserve (Fed) in 2024.
The US Chicago Purchasing Managers’ Index (PMI) declined faster than expected for December, printing at a contractionary 46.9, dropping through the market forecast of 51.0 and pulling further back from November’s 18-month high of 55.8. A worsening US economic outlook is counter-intuitively sparking risk appetite across broader markets, as investors look for anything to push the Fed into accelerating the uptake on the next rate-cutting cycle, currently expected to begin early next year, with the first rate slash broadly expected to occur in March or April.
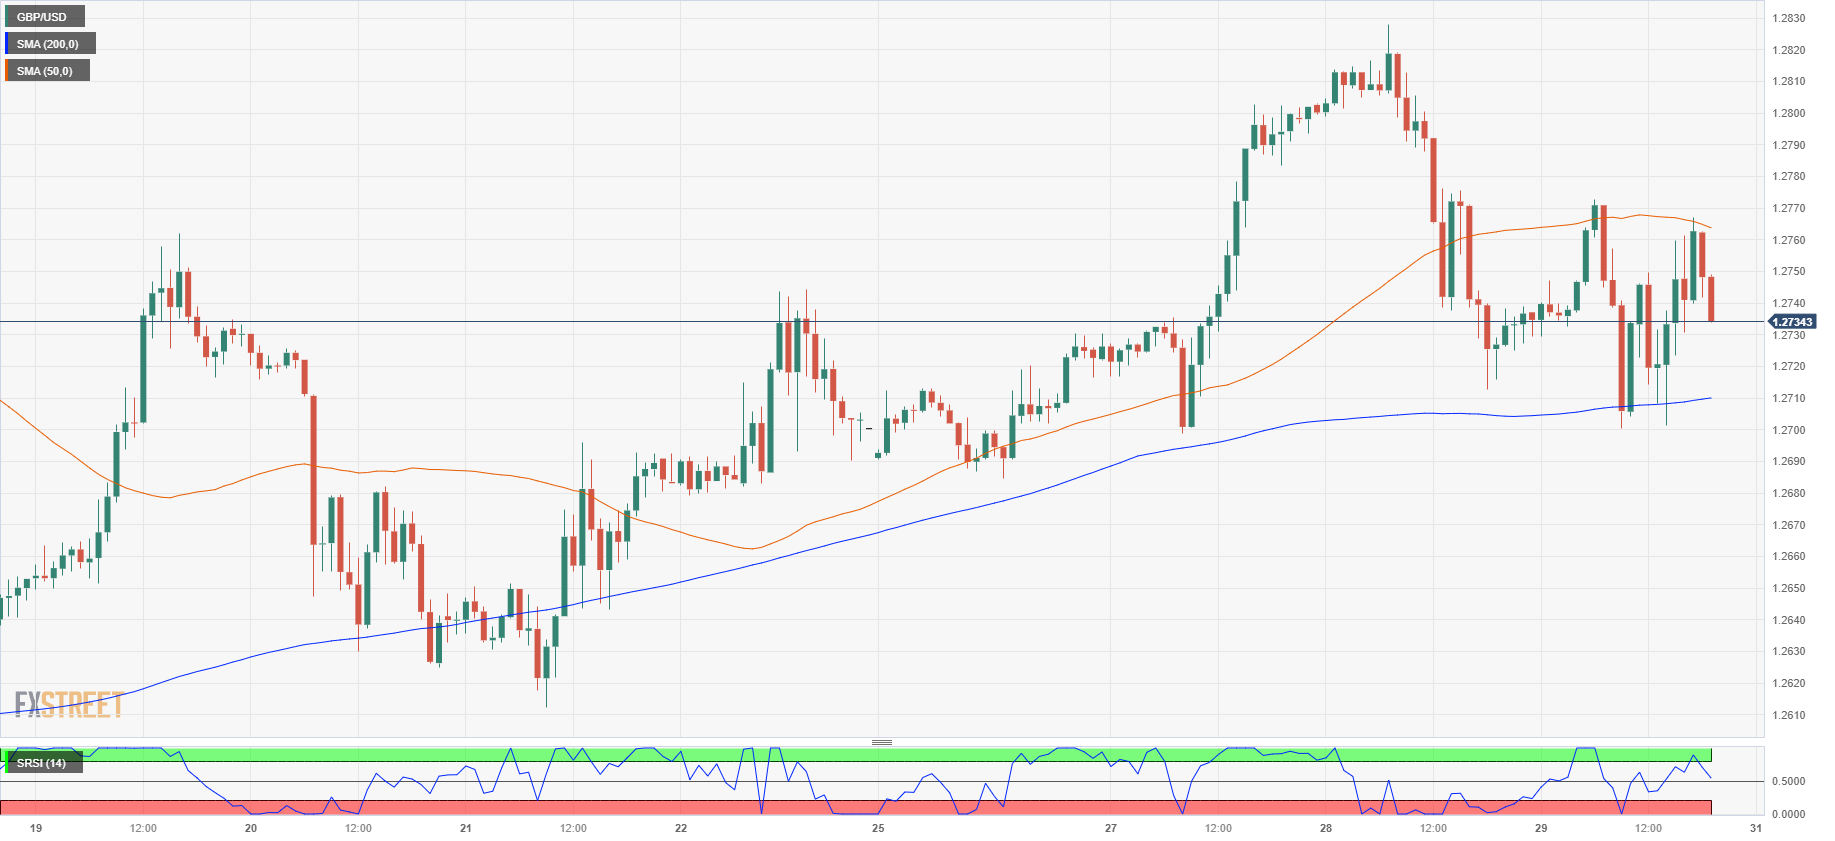
With markets gearing up for the rollover into the 2024 trading year, the GBP/USD is testing into a near-ter midrange as the pair gets squeezed between the 50-hour and 200-hour Simple Moving Averages (SMA) between 1.2760 and the 1.2700 handle.
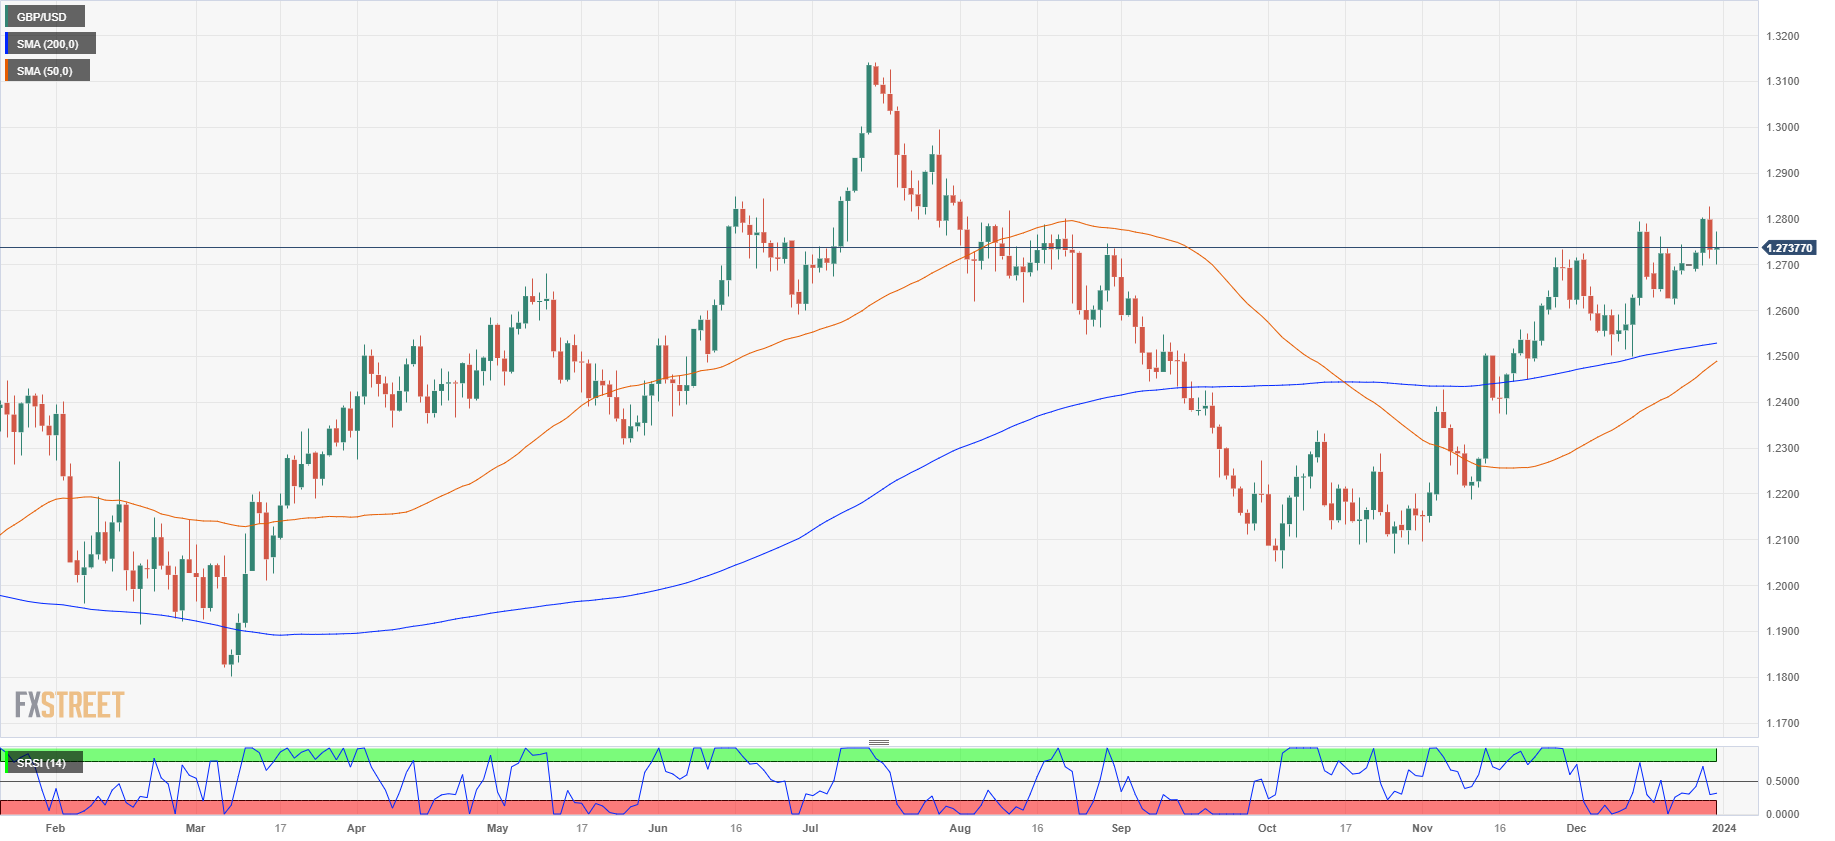
Daily candlesticks have the GBP/USD struggling to develop real momentum beyond the 1.2700 handle, despite a consistent higher-high/higher-low pattern baked into candles. With most of the pair’s upside momentum coming from broad-market USD short pressure, any recovery in the wider Dollar Index is likely to see a sharp drawdown for the Pound Sterling.