确认您不是来自美国或菲律宾

在此声明,本人明确声明并确认:
  • 我不是美国公民或居民
  • 我不是菲律宾居民
  • 本人没有直接或间接拥有美国居民10%以上的股份/投票权/权益,和/或没有通过其他方式控制美国公民或居民。
  • 本人没有直接或间接的美国公民或居民10%以上的股份/投票权/权益的所有权,和/或受美国公民或居民其他任何方式行使的控制。
  • 根据FATCA 1504(a)对附属关系的定义,本人与美国公民或居民没有任何附属关系。
  • 我知道做出虚假声明所需付的责任。
就本声明而言,所有美国附属国家和地区均等同于美国的主要领土。本人承诺保护Octa Markets Incorporated及其董事和高级职员免受因违反本声明而产生或与之相关的任何索赔。
我们致力于保护您的隐私和您个人信息的安全。我们只收集电子邮件,以提供有关我们产品和服务的特别优惠和重要信息。通过提交您的电子邮件地址,您同意接收我们的此类信件。如果您想取消订阅或有任何问题或疑虑,请联系我们的客户支持。
Octa trading broker
开通交易账户
Back

USD/CAD Price Analysis: Bulls moved in, reaches two-day high as a bullish-engulfing pattern looms

  • Bullish-engulfing candlestick pattern on the daily chart suggests buyers are in control.
  • The first major resistance at 1.3600, followed by several key levels up to 1.3804.
  • Downside risks include a drop below 1.3489, potentially targeting the 200-DMA at 1.3462 and the 50-DMA at 1.3345.

The Canadian Dollar (CAD) losses ground against the US Dollar (USD) sponsored on weaker than expected Canadian economic growth in the second quarter, alongside a mixed US jobs report and improvements in business activity. Hence, the USD/CAD is trading at 1.3595 after hitting a daily low of 1.3489, above its opening price by 0.65%.

USD/CAD Price Analysis: Technical outlook

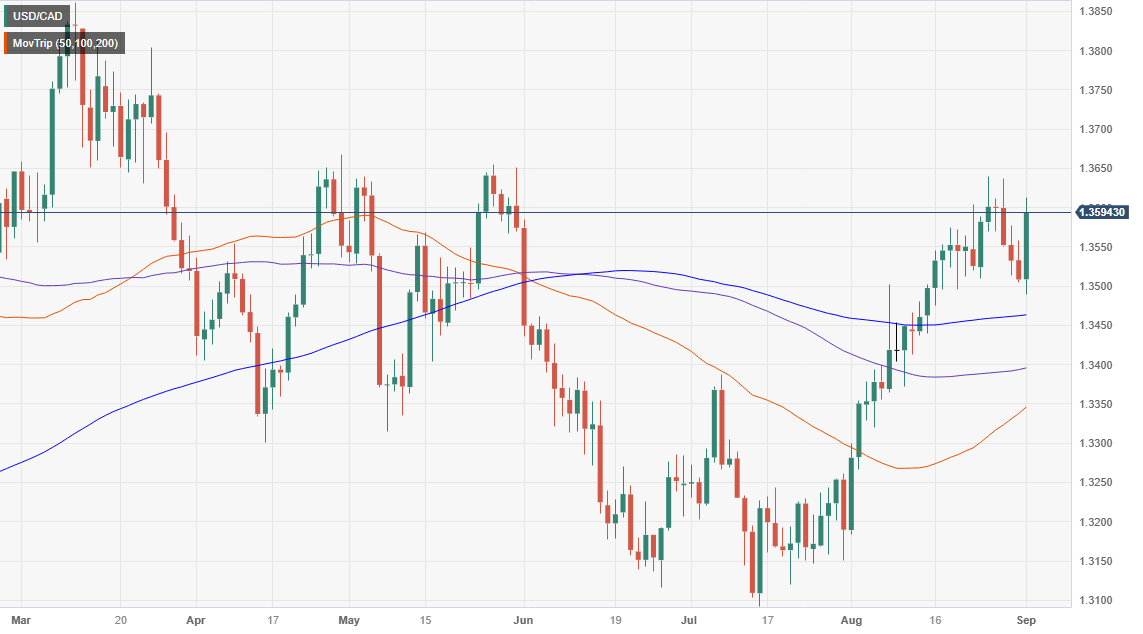
The daily chart portrays the pair as neutral to upward biased, though the major reached a lower low at 1.3489, slightly below the August 8 daily high at 1.3502. However, the USD/CAD recovery was outstanding, forming a bullish-engulfing candlestick chart pattern, which engulfed the price action of the previous two days. Hence, buyers are in charge.

The USD/CAD first resistance would be the 1.3600 figure. A breach of the latter will expose the August 25 high at 1.3640, closely followed by the May 26 swing high at 1.3654 and the April 28 high at 1.3667. Once those levels are cleared, the 1.3700 figure would be up next before rallying towards the March 24 daily high at 1.3804.

Conversely, if the USD/CAD drops below 1.3489, the pair could shift downwards and extend its losses toward the 200-day Moving Average (DMA) at 1.3462. Once cleared, the next stop would be the psychological 1.3400 area, and up next, the 50-DMA at 1.3345.

USD/CAD Price Action – Hourly chart


NZD/USD clears daily gains following US data

At the end of the week, the USD measured by the DXY index tallies daily gains after volatility seen in the markets after the release of August Nonfar
了解更多 Previous

Silver Price Analysis: Bears threatens the 100-day SMA amid USD strength

At the end of the week, the XAG/USD closed with losses but managed to hold some weekly gains, closing near $24.15. On the data front, the US released
了解更多 Next