提供最佳价差和条件
 关于平台
关于平台

Gold price (XAU/USD) is demonstrating a sheer squeeze in volatility amid the puzzle for monetary policy outlook by the Federal Reserve (Fed), which will be announced next week. The policy puzzle is getting more confusing as First Republic Bank has come under scrutiny after the collapse of Silicon Valley Bank (SVB) and Signature Bank.
Federal Reserve executes its monetary policy through commercial banks, which are going through a rough phase and investors are worried that more burden of higher rates would lead to more banks’ debacles.
The street believes that the reason behind deepening fears of a banking crisis is the steepest and fastest interest rate hikes from the Fed. Therefore, the odds of an unchanged monetary policy have stemmed. However, the CME Fedwatch tool is showing mere 20% chances that Fed chair Jerome Powell would keep interest rates steady.
S&P500 futures are showing nominal losses in the Asian session after a super-bullish Thursday, however, the risk appetite is still solid. The US Dollar Index (DXY) continues to juggle around 104.40 as investors are awaiting the preliminary Michigan Consumer Sentiment Index (March) data. A steady number is anticipated at 67.0. Meanwhile, the return generated on the 10-year US Treasury bonds looks sticky at around 3.58%.
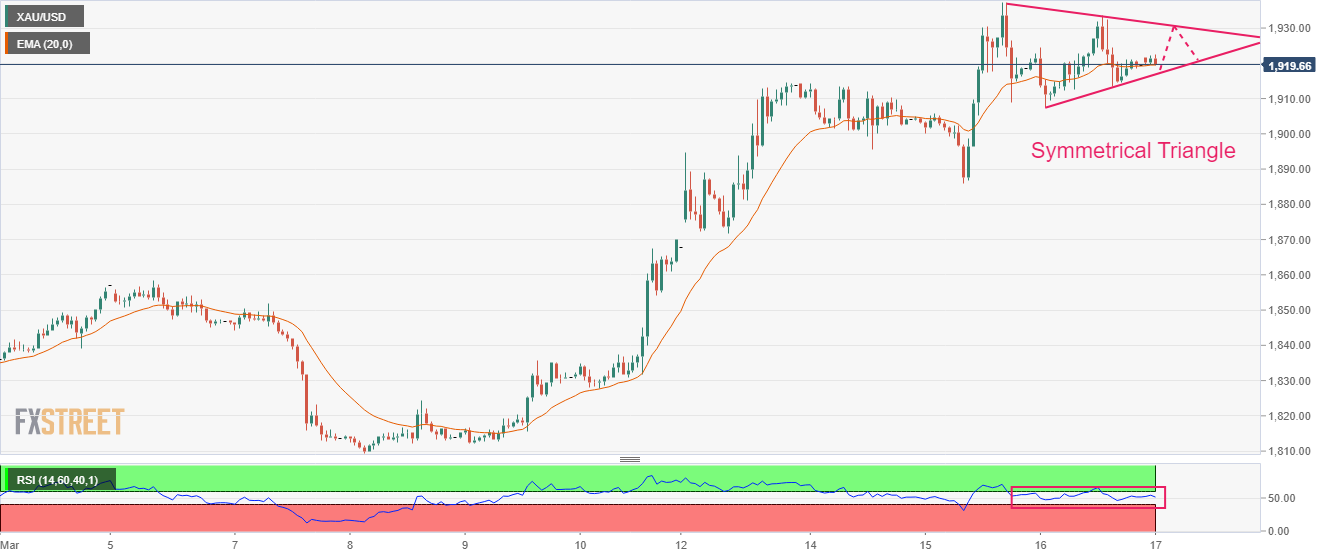
Gold price is auctioning in a Symmetrical Triangle chart pattern on an hourly scale, which indicates a squeeze in volatility that is followed by an expansion in the same. The downward-sloping trendline of the aforementioned chart pattern is placed from March 15 high around $1,939.40 while the upward-sloping trendline is placed from March 16 low at $1,907.56.
Overlapping 20-period Exponential Moving Average (EMA) at $1,919.60 with the asset indicates a rangebound move.
Adding to that, the Relative Strength Index (RSI) (14) is oscillating in the 40.00-60.00 range, which indicates that investors are awaiting a potential trigger for further action.