

USD/CAD Price Analysis: Bearish harami candle pattern to sink prices toward 1.3500
- USD/CAD falls amidst broad US Dollar weakness across the board.
- The SVB crisis in the United States sent ripples in the financial markets, with UST bond yields plummeting.
- USD/CAD Price Analysis: In the near term, neutral to downward biased.
USD/CAD drops from around daily highs of 1.3815, falls 0.90% on overall US Dollar (USD) weakness, spurred on an ongoing Regional Bank crisis in the US. Therefore, UST bond yields plunge; consequently, the buck is down. At the time of writing, the USD/CAD is trading at 1.3692.
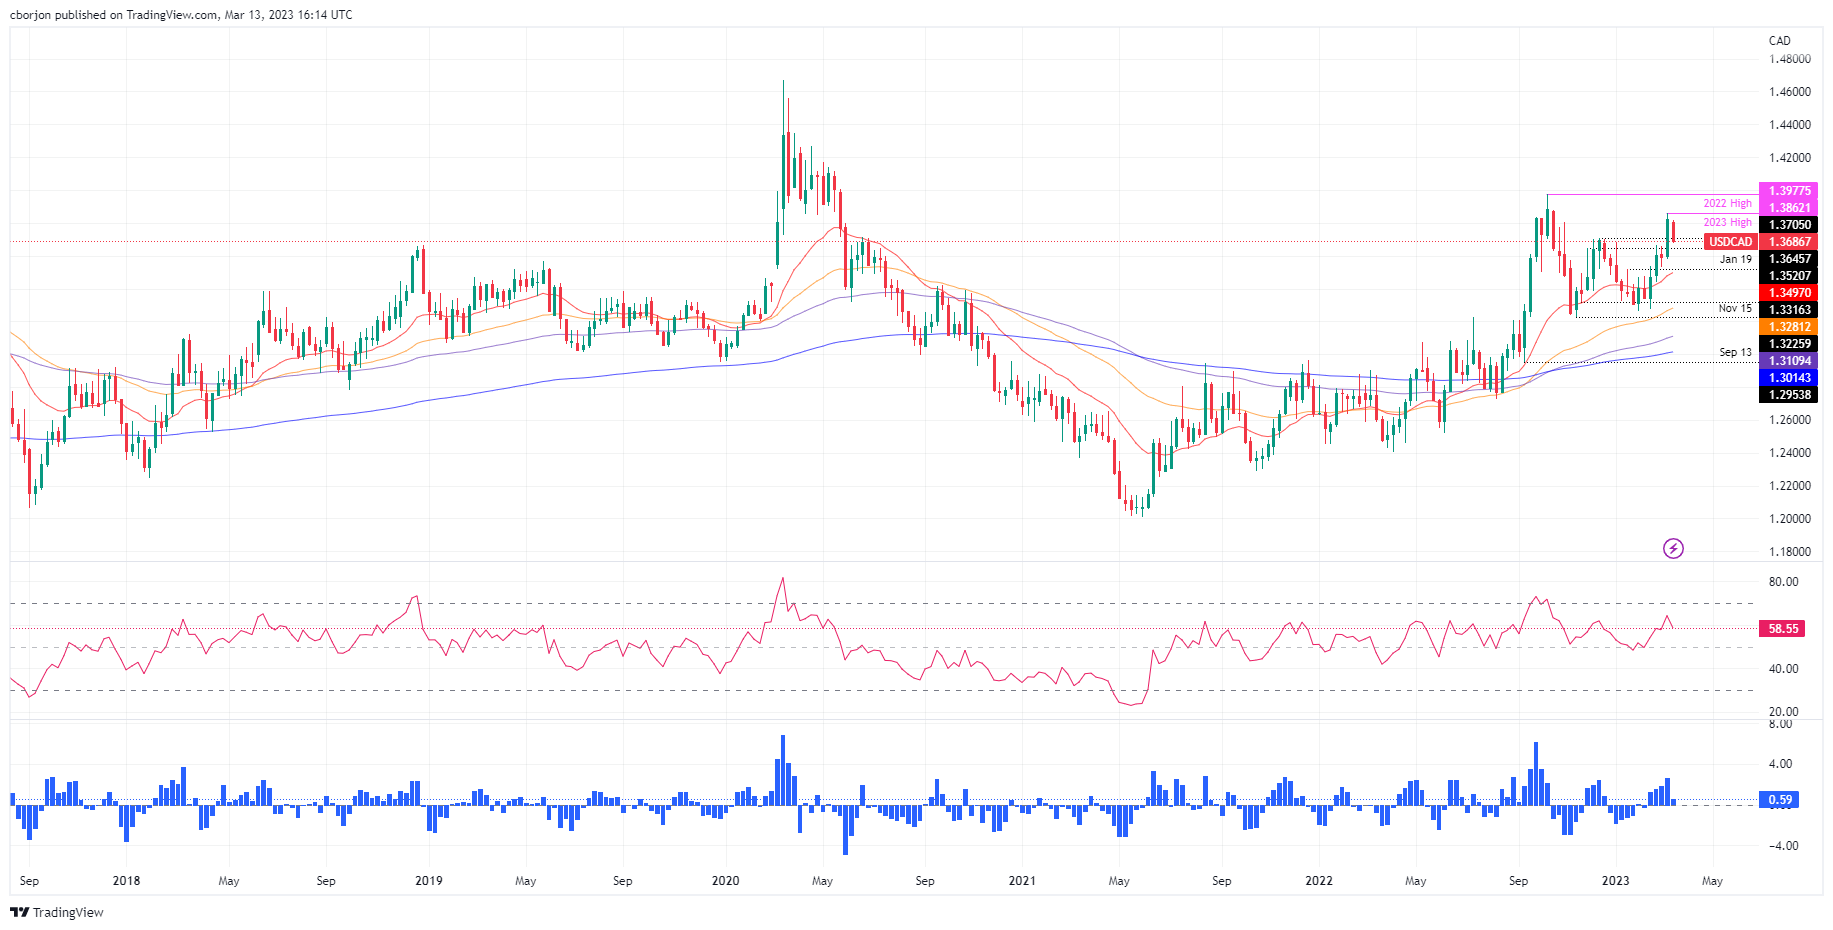
USD/CAD Price Action
After rallying to YTD highs of 1.3862, the Canadian dollar (CAD) is recovering some ground, eyeing a daily close below the December 12 high at 1.3705. Even though the financial markets are punishing the US Dollar (USD), safe-haven flows would increase volatility in USD-denominated currency pairs. If the banking crisis ease, traders should expect a repricing of the Fed, meaning further upside in the USD/CAD is expected.
In the short term, the USD/CAD might fall toward 1.3600, but solid support areas would face it. The first support would be the February 20 daily high at 1.3665, followed by the 1.3600 figure. A breach of the latter will expose the 20-day Exponential Moving Average (EMA) at 1.3496 before testing the 50-day EMA at 1.3280.
In an alternate scenario, the USD/CAD first resistance would be 1.3700. Once cleared, the pair could rally towards the 1.3800 area, ahead of testing the YTD high at 1.3862.
Oscillators like the Relative Strength Index (RSI) at 58.22 aiming lower suggests that sellers are gathering momentum. The Rate of Change (RoC), shifted toward neutral territory, displaying that buying pressure is waning.
Trend: In the near term, neutral to downwards.
USD/CAD Daily Chart
USD/CAD Technical Levels