提供最佳价差和条件
 关于平台
关于平台

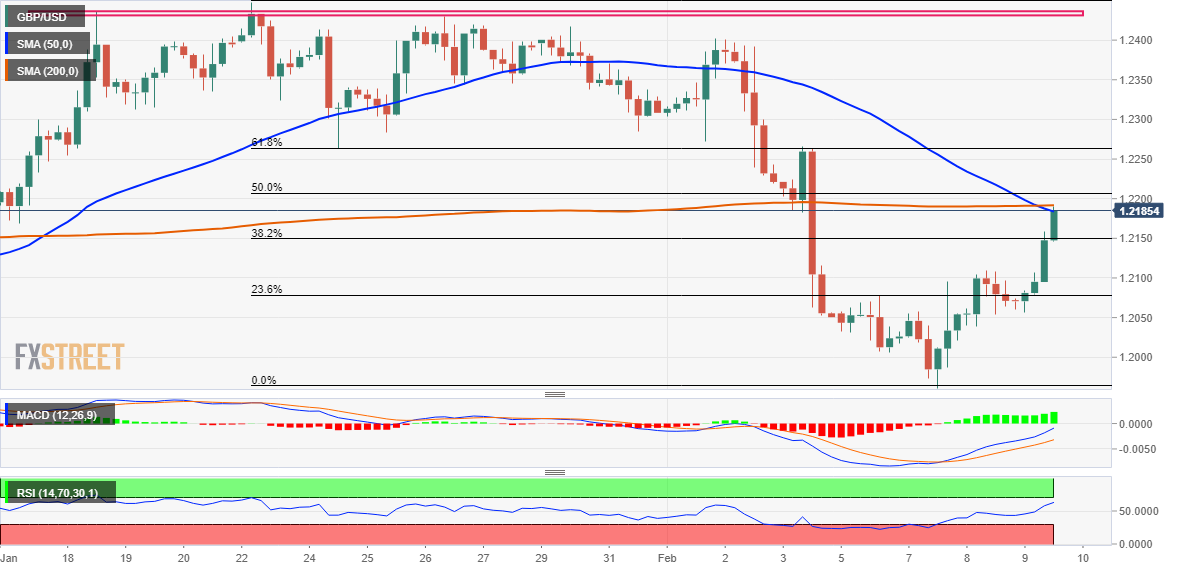
The GBP/USD pair builds on this week's rebound from the vicinity of the very important 200-day SMA, or a one-month low around the 1.1960 area and scales higher for the third straight day on Thursday. The positive momentum remains uninterrupted through the early North American session and pushes spot prices to a fresh weekly high, around the 1.2175 region in the last hour.
A sustained move beyond the 1.2100 mark was seen as a key trigger for bullish traders amid broad-based US Dollar weakness. A subsequent break through the 38.2% Fibonacci retracement level of the recent pullback from a multi-month high touched in January might have already set the stage for additional gains. The positive outlook is reinforced by the fact that technical indicators on the 4-hourly chart have been gaining positive traction.
That said, the Relatively Strength Index (RSI) on the 1-hour chart is already flashing overbought conditions. Adding to this, oscillators on the daily chart - though have been recovering from the bearish territory - are yet to confirm the positive bias. Hence, any subsequent positive move is likely to remain capped near the 1.2190-1.2200 confluence hurdle, comprising technically significant (50-period and 200-period SMAs on the 4-hour chart) and the 50% Fibo. level.
Bulls might wait for some follow-through buying beyond the aforementioned barrier before placing fresh bets amid expectations that the Bank of England's rate-hiking cycle is nearing the end. The GBP/USD pair might then accelerate the momentum towards the 61.8% Fibo. level, around the 1.2255-1.2260 area en route to the 1.2300 round-figure mark
On the flip side, the 38.2% Fibo. level, around the 1.2145 zone, now seems to protect the immediate downside. Any further pullback might now be seen as a buying opportunity near the 1.2100 mark, which should act as a pivotal point. This is followed by 23.6% Fibo. level support near the 1.2075 area, which if broken decisively will suggest that the corrective bounce has run its course and make the GBP/USD pair vulnerable to resume its downtrend.