

Gold Price Analysis: XAU/USD meanders around $1650, capitalizing on a weak US Dollar
- Gold price grinds higher by 0.24%, though facing solid resistance around $1660.
- If XAU/USD clears $1670, a test of $1700 is on the cards.
- A formation of a bullish flag in the XAU/USD hourly chart opens the door for further upside.
Gold price advances steadily during the North American session, though it remains capped below the 20-day Exponential Moving Average (EMA), despite falling US Treasury yields underpinning the yellow metal prices, as gold recovers after hitting a daily low of $1638.40. At the time of writing, the XAU/USD is trading at $1653 a troy ounce, above its opening price by 0.24%.
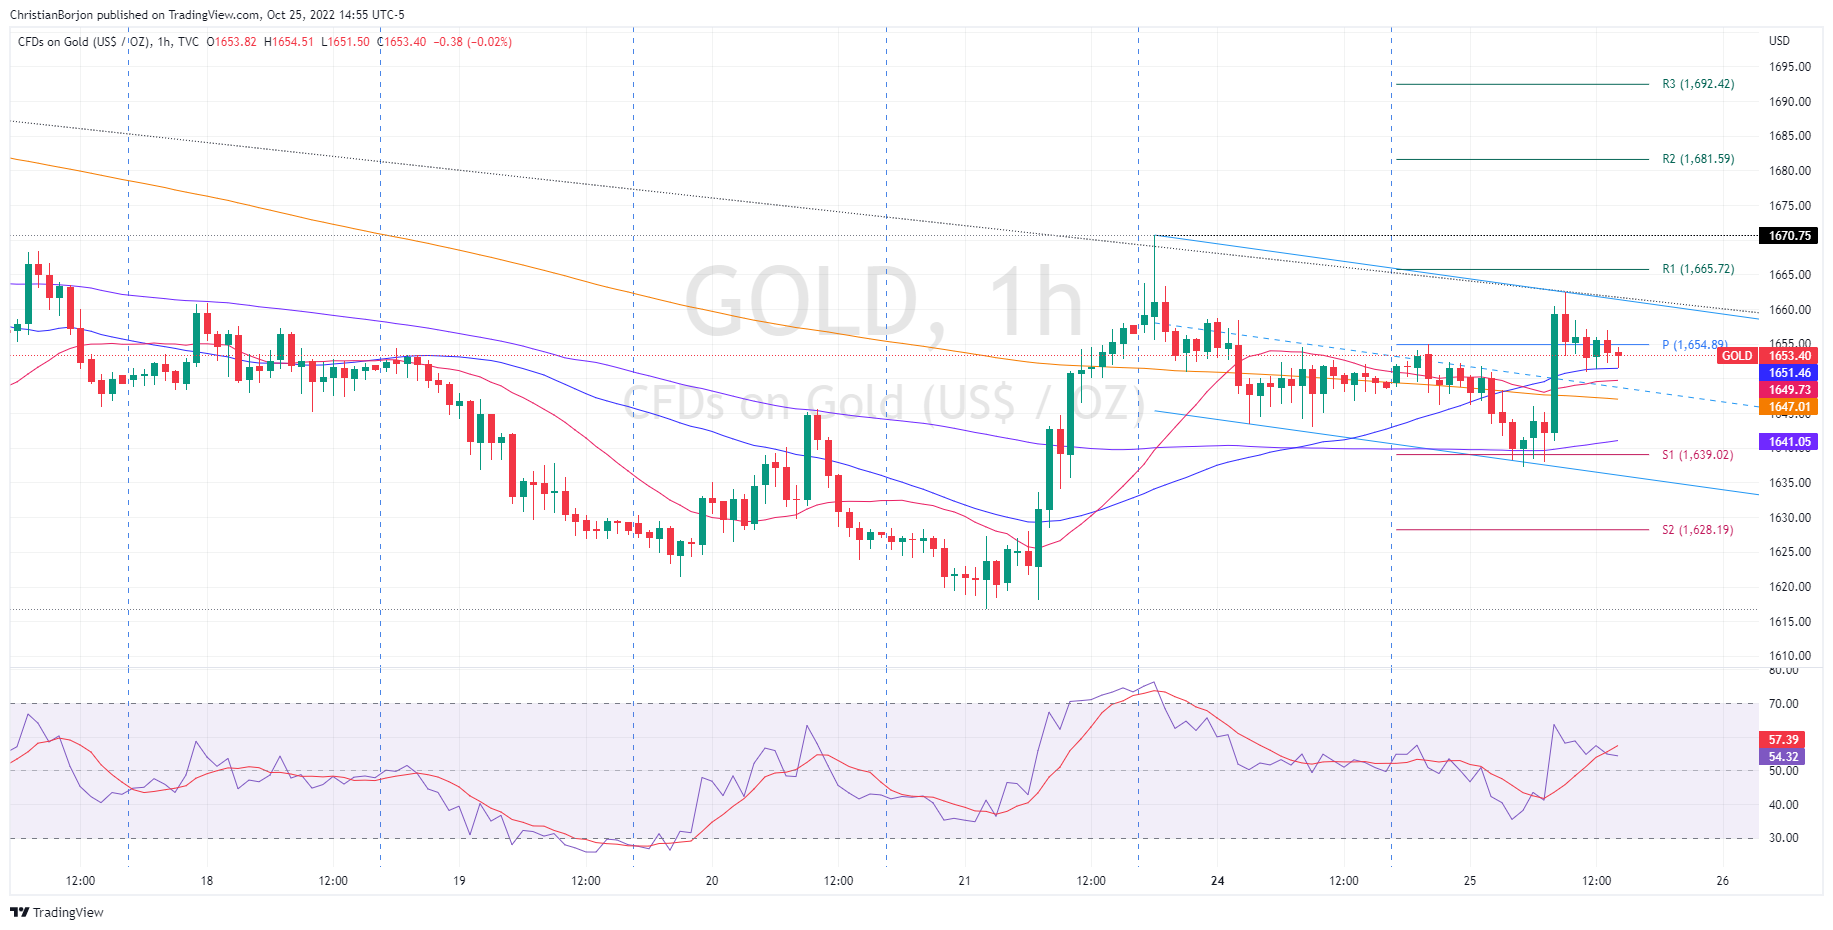
XAU/USD Price Forecast: Technical outlook
From a daily chart perspective, XAU/USD is downward biased, as it has remained since sliding below the 200-EMA in mid-June 2022. Worth noting that Tuesday’s daily high was shy of hitting a downslope trendline, drawn from October highs, which confluences with the 20-day EMA. So XAU buyers need to clear $1670, to exacerbate a rally towards the 100-day EMA at $1690, ahead of $1700. On the flip side, a daily close below Monday’s low of $1644 would cement gold’s downward biased, which would be unable to capitalize, despite lower US bond yields, opening the door for further losses.
Short-term, the XAU/USD hourly chart illustrates the formation of a bullish flag, opening the door for further gains. Worth noting that gold is neutral-to-upward biased, and once it clears, the October 24 high of $1670 will exacerbate a rally toward $1700.
The XAU/USD first resistance would be the R1 daily pivot at $1665, ahead of $1670. Break above will expose the R2 pivot at $1681, followed by the R3 daily pivot level at $1692.42, ahead of $1700.
On the other hand, if XAU/USD slumps below the confluence of several EMAs, lead by the 50, 20, and 200-EMA around $1647-$1651, would send the yellow-metal price toward the convergence of the 100-EMA and the S1 daily pivot around $1639-41. Once cleared, the following demand zone would be the bullish-flag bottom trendline around $1636.
XAU/USD Key Technical Levels