Gold Price Forecast: XAU/USD behaves lackluster around $1,650 ahead of US GDP data
- Gold price has turned sideways around $1,650.00 after a corrective move as yields rebound.
- Weaker PMI data weighed pressure on the DXY.
- The release of the GDP data will be a major trigger this week.
Gold price (XAU/USD) is displaying back-and-forth moves around $1,650.00 in the early Asian session. The precious metal is following the footprints of the US dollar index (DXY) and is performing lackluster. The DXY is oscillating around 112.00 after dropping from 112.50 on Monday. The release of the downbeat US S&P PMI data terminated DXY’s attempts of shifting into a positive trajectory.
The Manufacturing PMI landed lower at 49.9 vs. the projections of 51.2. Also, the Services PMI reported a weak performance as dropped to 46.6 against the expectations of 49.2. A vulnerable PMI data restricted the upside in the DXY.
The gold prices were underperforming despite the upbeat market mood. The catalyst that weighed pressure on the gold prices was the sheer recovery in the returns from US government bonds. The 10-year US Treasury yields recovered sharply after dropping to near 4.15% and settled Monday with gains of 0.82% at 4.25%.
Going forward, the release of the US Gross Domestic Product (GDP) data will be keenly watched. The annualized GDP is expected to improve significantly to 2.4% vs. a decline of 0.6% reported earlier. A firmer increment in the US growth rate could bring volatility in gold prices.
Gold technical analysis
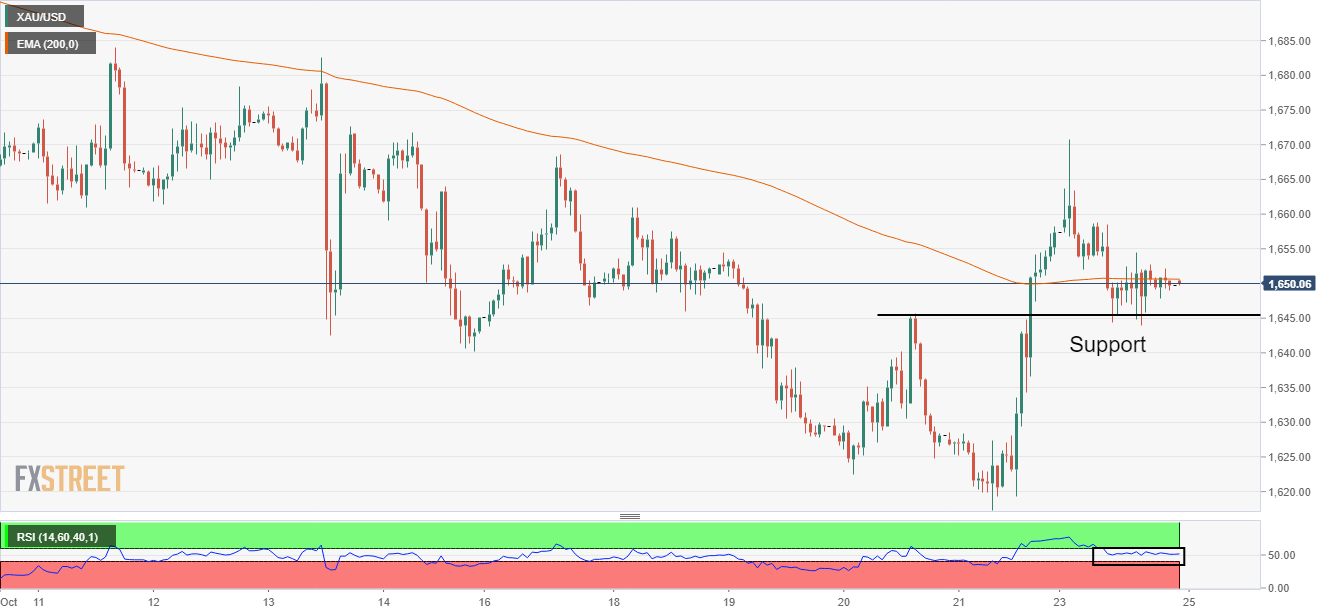
On an hourly scale, gold prices have dropped after facing barricades of around $1,670.00. The precious metal has declined to near the horizontal support placed from Thursday’s high at $1,645.67. The yellow metal is hovering around the 200-period Exponential Moving Average (EMA) at $1,650.46.
Meanwhile, the Relative Strength Index (RSI) (14) is oscillating in a 40.00-60.00 range, which indicates the unavailability of a potential trigger for a decisive move.
Gold hourly chart