
提供最佳价差和条件
 了解更多
了解更多

The USD/JPY pair continued its 12-day winning streak on Friday by overstepping Thursday’s high at 150.29. The asset is not reacting to any rebound in the risk-on impulse but is capitalizing negative market sentiment period effectively. Ultra-loose monetary policy is responsible for the sheer destruction of the Japanese yen.
The US dollar index (DXY) is gathering interest for stabilization above the critical hurdle of 113.00. While the returns on US government bonds are soaring like there is no tomorrow. The 10-year US Treasuring yields are continuously refreshing their 14-year highs. At the time of writing, 10-year yields stand at 4.26%.
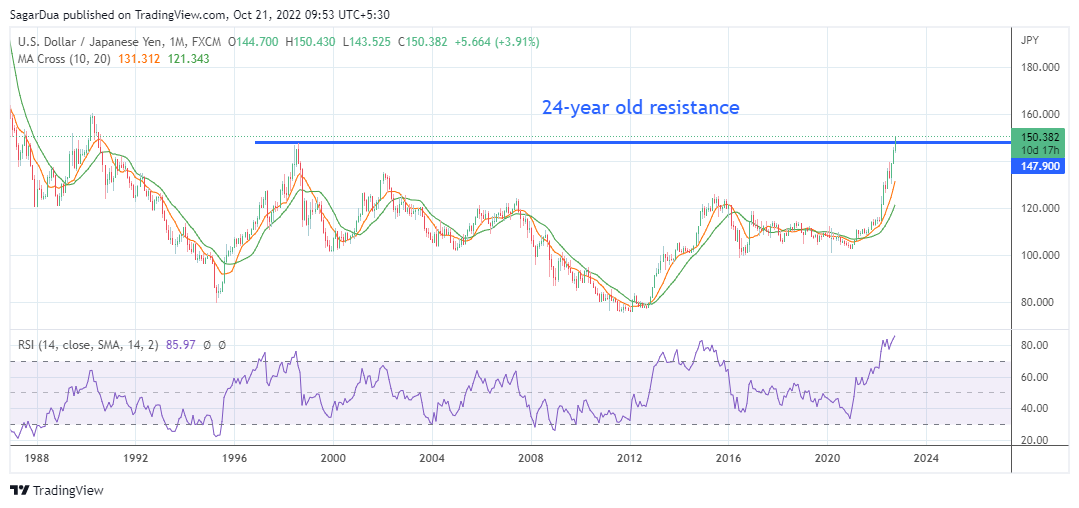
An upside break of the 24-year-old resistance at 147.67 has infused adrenaline rush into the greenback bulls. The 10-and 20-period Exponential Moving Averages (EMAs) at 131.31 and 121.34 respectively are advancing, which indicates more upside ahead.
The Relative Strength Index (RSI) (14) has printed a high near 86.00. There is no denying the fact that the momentum oscillator is showing overbought signals. However, the absence of divergence signals and momentum loss is not favoring any correction yet.
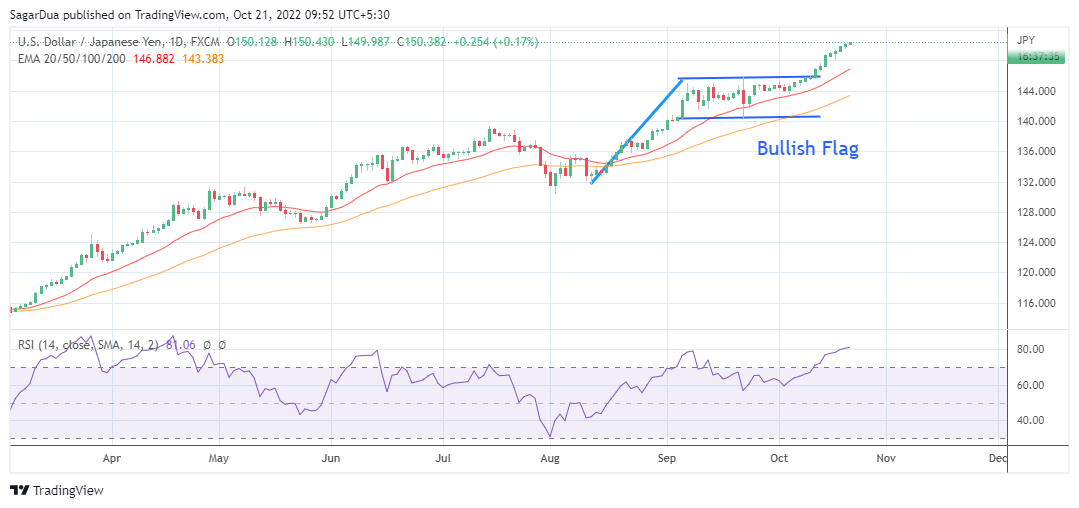
On a daily scale, the asset has delivered a perpendicular upside move after a breakout of the Bullish Flag. The chart pattern indicates an upside break of the mark-up inventory adjustment. Advancing 20-and 50-period EMAs at 146.68 and 143.38 respectively adds to the upside filters.
Also, the RSI (14) has crossed 80.00, showing no signs of divergence but an overbought situation cannot be ruled out.
A mild correction towards the psychological support of 150.00 will present a bargain buy for investors, which will drive the asset towards a fresh 32-year high at 150.43, followed by July 1990 high at 152.25.
On the flip side, the asset could trigger reversal if it drops below Monday’s low of 148.11, which will drag the asset towards the October 13 high at 147.67. A slippage below the latter will further drop the major to October 13 low at 146.42.


