

Gold Price Analysis: Path of least resistance is up, bullish levels to watch – Confluence Detector
Gold has been bouncing off the lows, which now turn into robust support. XAU/USD faces weaker resistance but bulls need to push it above two hurdles to allow the precious metal to run.
The Technical Confluences Indicator is showing that gold faces resistance at $1,815, which is a juncture including the Bollinger Band 1h-Upper, the Simple Moving Average 10-15m, the SMA 5-15m, and the previous weekly high.
The next hurdle is at $1,821, where the Pivot Point one-month Resistance 1 and the PP one-week R1 converge.
Some support awaits at $1,809, which is the confluence of the BB 15min-Lower, the Fibonacci 23.6% one-week, and the previous 4h-low.
Strong support is at $1,806, which is a dense cluster including the SMA 200-1h, the Fibonacci 38.2% one-day, the SMA 50-4h, the SMA 5-one-day, the BB 1h-Lower, the Fibonacci 38.2% one-week, and more.
Here is how it looks on the tool:
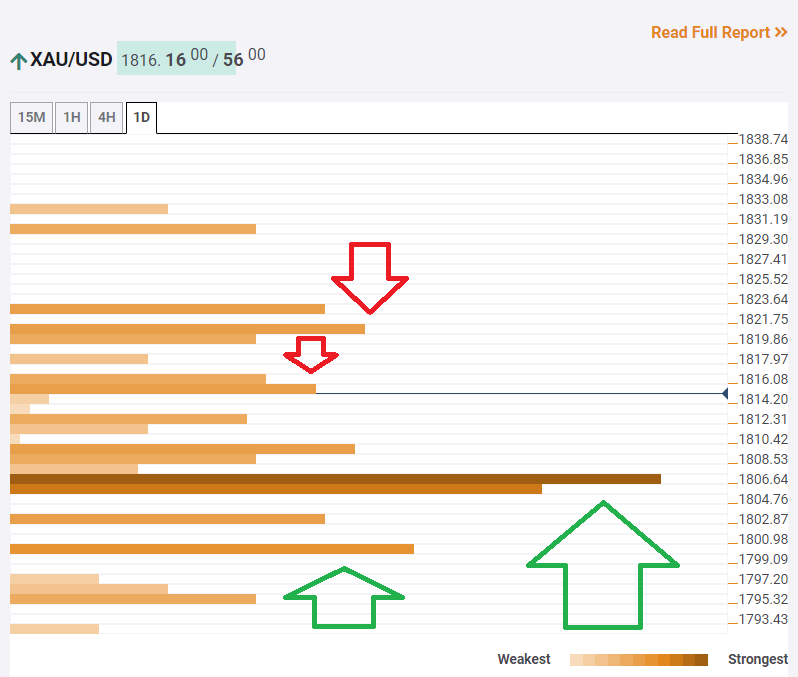
Confluence Detector
The Confluence Detector finds exciting opportunities using Technical Confluences. The TC is a tool to locate and point out those price levels where there is a congestion of indicators, moving averages, Fibonacci levels, Pivot Points, etc. Knowing where these congestion points are located is very useful for the trader, and can be used as a basis for different strategies.
This tool assigns a certain amount of “weight” to each indicator, and this “weight” can influence adjacents price levels. These weightings mean that one price level without any indicator or moving average but under the influence of two “strongly weighted” levels accumulate more resistance than their neighbors. In these cases, the tool signals resistance in apparently empty areas.
Learn more about Technical Confluence